

How a Farmer from Ohio Learned to Predict Crises
Benner's Cycles demonstrate periodicity, where each century has its own "dark period" when the world literally shakes from economic, political, or military upheaval.

In the mid-19th century, financial crises and economic downturns were frequent, ruining thousands of farmers and entrepreneurs. Samuel Benner, a farmer from Ohio, became one of the victims of the Panic of 1873, a financial crisis that began with the collapse of several railroad companies and led to a prolonged depression in the U.S. economy. Having lost a significant portion of his wealth, Benner set out to find a way to predict such crises and help others avoid repeating his fate. That was the origin of the market cycle idea.
Samuel Benner’s Life Before the Crisis
Samuel Benner was born in 1832 into a farming family in Ohio. From childhood he was accustomed to hard work on the land and grew up surrounded by agricultural traditions. The economic instability of the mid-19th century posed serious problems for farmers dependent on crop prices. Nevertheless, before the crisis of 1873, Benner managed to run a relatively successful farm.
In the 1870s, the U.S. economy was booming, driven by railroad construction and industrial development. Farmers were actively expanding their operations, often taking on debt. Then the growth period came to an abrupt end when the collapse of several large railroad companies triggered a large-scale financial panic.
The Crisis of 1873
The 1873 crisis happened because many people and companies had borrowed too much and invested in projects that weren’t profitable. In the U.S. and Europe, railroads were hit especially hard, having been everyone’s great hope. When they began going bankrupt, many people lost their money and banks closed. This led to a major economic collapse: people lost jobs and businesses shut down. All of it happened because of too much trust in risky investments and poor use of capital.
This event was a heavy blow for many farmers, including Samuel Benner. The main problems he faced included:
A sharp drop in agricultural commodity prices: due to falling demand and the general economic downturn, prices for goods produced by farmers fell to critically low levels. This led to enormous losses and made it impossible to service debts.
A heavy debt burden: many farmers, including Benner, had taken out loans to expand their operations during the economic boom. When prices fell, servicing those loans became impossible, leading to widespread bankruptcies.
The absence of tools for predicting crises: at the time, it was difficult for farmers and entrepreneurs to anticipate economic downturns. Any market shifts happened suddenly, which made them especially destructive.
The core problem Benner was trying to solve was the lack of tools for farmers and entrepreneurs to forecast market fluctuations. At the time, prices for agricultural commodities and industrial assets could shift sharply under the influence of external factors: weather conditions, political crises, and market speculation.
Benner’s Cycles offered a simple but effective forecasting method that allowed:
Farmers to plan production and sales more effectively, maximizing profit. Investors to make better-informed decisions about buying and selling assets, avoiding panic selling and investing during periods of low prices. Entrepreneurs to plan business development with an eye to future economic downturns and upturns.
The Emergence of Benner’s Cycles
After going bankrupt, Benner began collecting and analyzing historical price data on various commodities, including iron, corn, cotton, and pork. The idea for the cycles came to him after long reflection on why economic downturns arrive suddenly and with frightening regularity. He noticed that looking at price history over an extended period revealed certain recurring patterns. In 1875, Samuel Benner published a book titled “Benner’s Prophecies of Future Ups and Downs in Prices.” It laid out the findings of his research and presented forecasts for the future. The book included charts and tables illustrating price cycles for various commodities, along with recommendations on when to buy and sell assets.
The key solutions Benner proposed were as follows:
Planning sales and purchases: farmers and entrepreneurs were advised to sell products at the peak of price cycles and purchase resources during price downturns.
Avoiding panic selling: knowing about the recurrence of panic cycles, investors could stay calm during downturns and avoid selling assets at depressed prices.
Long-term planning: using the predictable cycles, one could plan business development years in advance, avoiding excessive debt loads during economic downturns.
Samuel literally studied every year, every price movement, and found that behind the apparent chaos lay a distinct rhythm. Pig-iron price cycles followed a specific pattern: the periods between price lows shrank in sequence, running 11, 9, and 7 years before a new cycle began. Meanwhile, the periods between price highs lengthened, running 8, 9, and 10 years. In both cases, full cycles consisting of three such periods spanned 27 years. The rhythm of rises and falls was also orderly. Rises lasted 4, 3, and 2 years; declines lasted 7, 6, and 5 years.
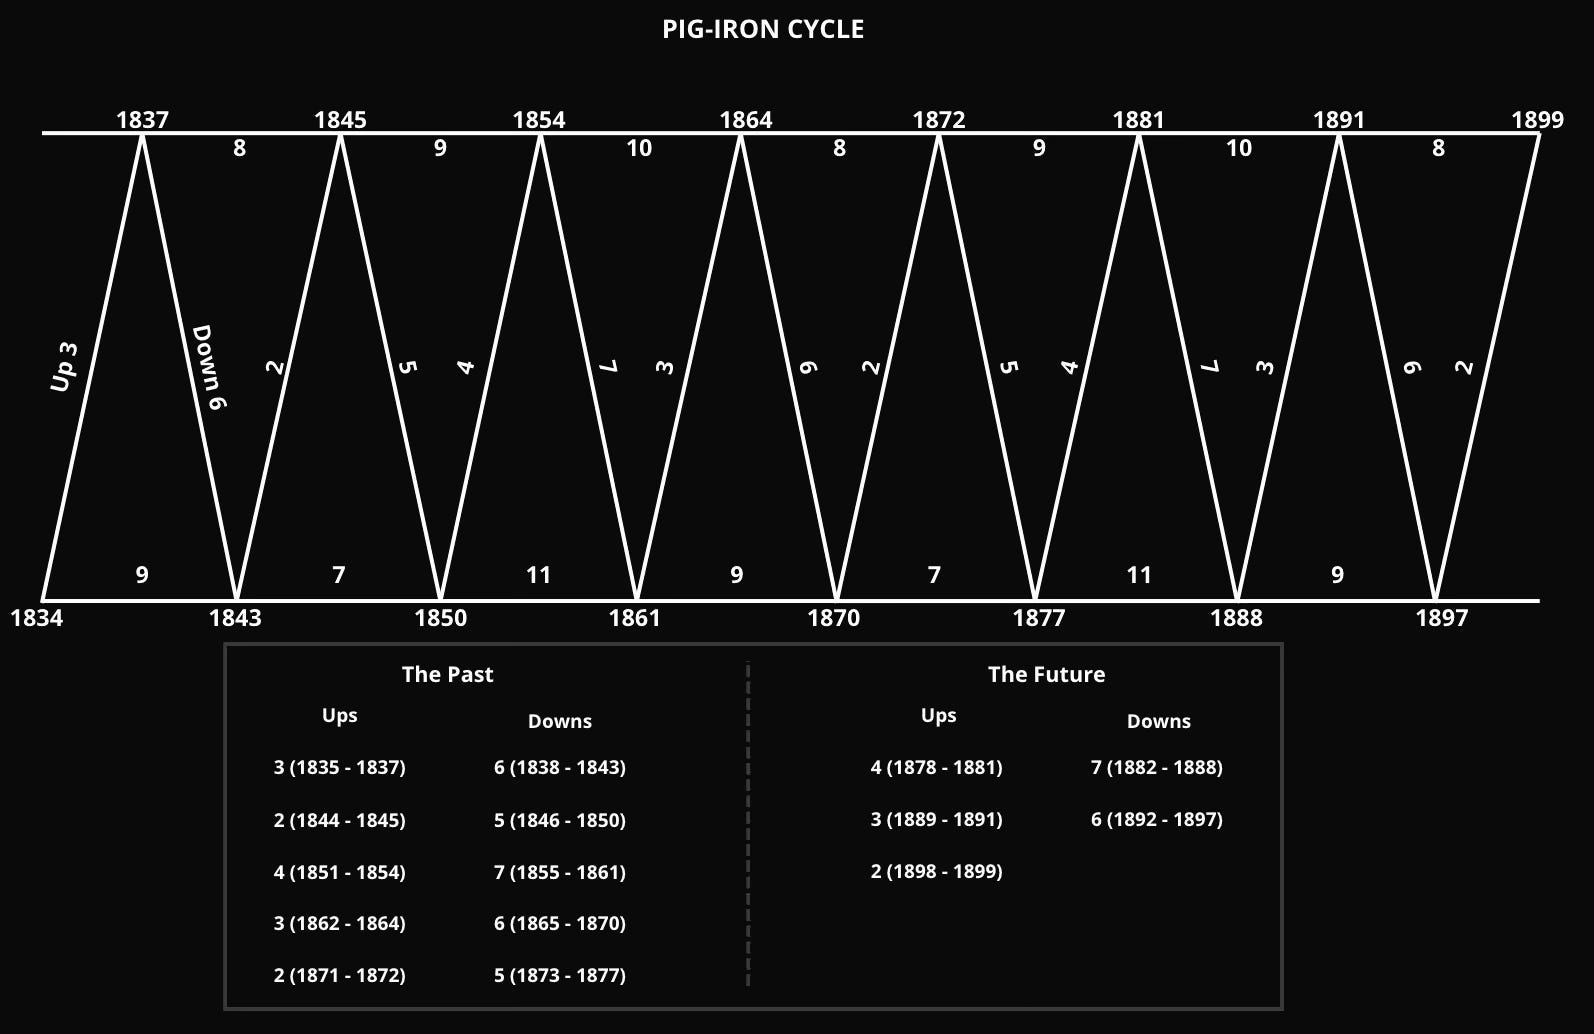
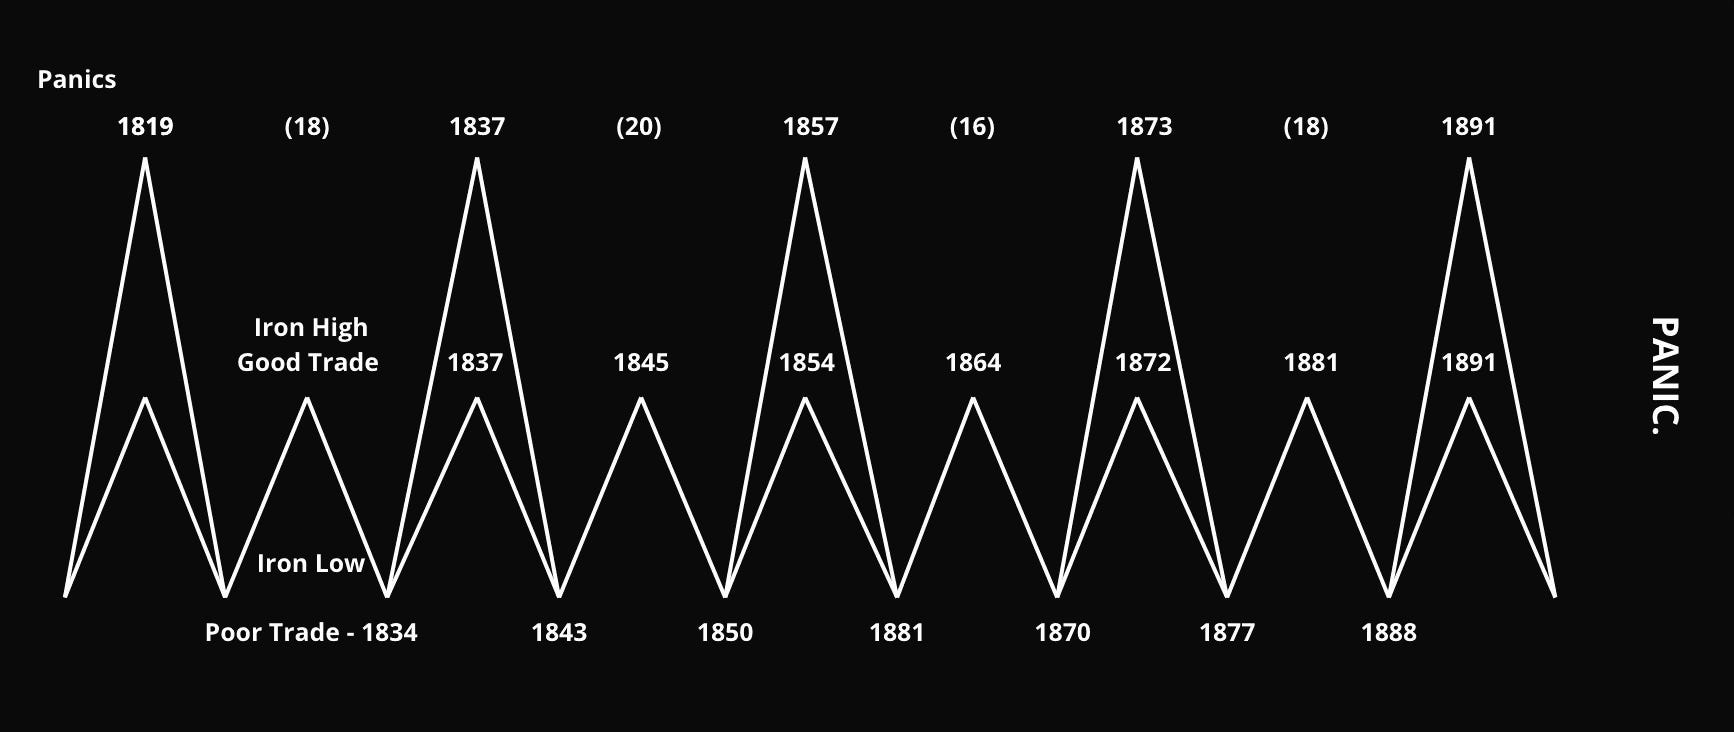
Benner connected these cycles to the influence of historical events, wars and financial crises, showing that external factors contribute to the natural course of economic cycles. In his view, major panics also occur with their own specific periodicity:
“Cycles of panics and fluctuations in prices of farm and industrial products are but the effects of a cause, which manifests in periods of 16, 18, and 20 years for panics. These cycles repeat in the same order every 54 years, with periods of 8, 9, and 10 years for metal prices, which also return in the same order every 27 years.”
One of the most well-known predictions Benner made during his lifetime was his forecast of the next major economic crisis, which did arrive in 1893, twenty years after the Panic of 1873. His theory of 20-year panic cycles was confirmed, which drew additional attention to his work from economists and investors.
“Benner’s chart so accurately predicted the pig-iron price cycle that through World War II the profit-to-loss ratio was 44 to 1.” — Edward Dewey, Chief Economic Analyst of the U.S. Department of Commerce and Director of the Foundation for the Study of Cycles, 1967.
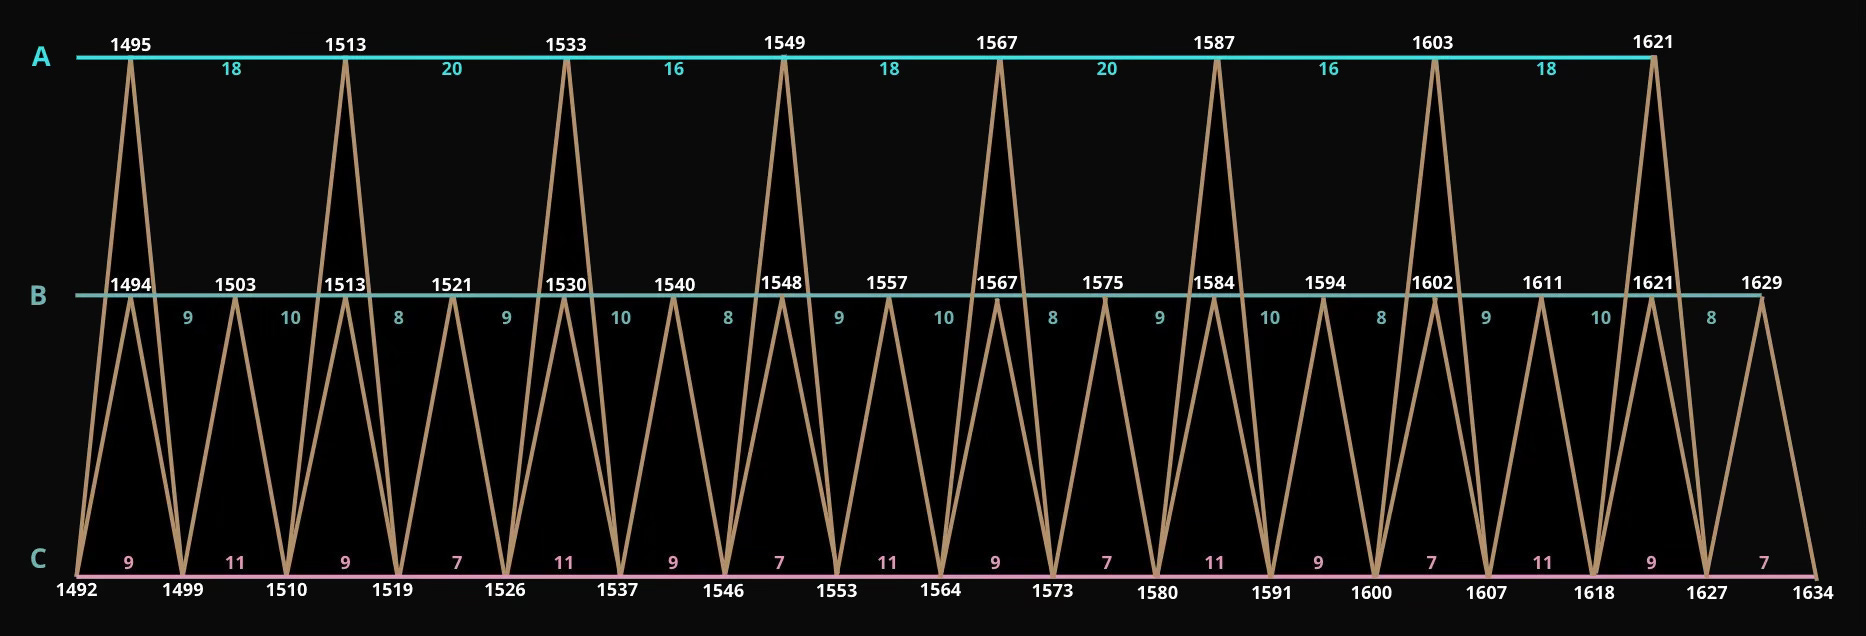
The minor cycles on the commodities Benner studied align with the larger crisis cycles, which would later be organized into three variations of peak (A, B) and low (C) asset and commodity prices:
A: Years in which crises and panics began or will begin, which may repeat in the future.
B: Years of good times with high prices, when selling stocks and other assets is recommended.
C: Years of hard times with low prices, when buying assets and waiting for price growth is recommended.
Simplified, each cycle takes the following form:
Although after World War II pig-iron prices stopped correlating with Benner’s cyclicality, the cyclicality of economic crises remained.
The constant development of our world cannot be overlooked. In the 19th century, the economy was focused on industrial development, where pig iron was the key resource for building railroad infrastructure, advancing shipping, and driving heavy industry, while coal served as the primary energy source, enabling large-scale production. In the 20th century, the center of gravity shifted to energy and mass production. Oil became the defining resource, driving transportation, electricity, and the chemical industry. The introduction of assembly lines, pioneered by Ford, revolutionized production and made goods more accessible. Human labor was gradually replaced by mechanization and automation.
From the 1970s onward, the digital revolution took hold. Microprocessors, the internet, and personal computers transformed the economy, placing intellectual labor at the center, with data becoming the new key resource. Biotechnology opened new possibilities in medicine and agriculture.
We are now entering an entirely new era. The economy is no longer about production: it’s about the creation of knowledge. Artificial intelligence, quantum computing, renewable energy, biotechnology: these are the new engines of progress. But it’s not just technology that’s changing. The entire social context is shifting. Education, finance, law: all of it is adapting to the new reality. We’re moving from an age of “making with hands” to an age of “thinking and creating.”
The Past
A small discussion on Reddit, where someone posed a perfectly logical question: “Does this predict, for example, the Spanish silver crash of the late 1500s?”, became the impulse for exploring a broader time frame. To get an answer, the data had to be extrapolated backward by 500 years.
The answer to the original question about the Spanish silver crash of the late 1500s is 1575. Under the reign of Philip II, silver played a key role in Spain’s financial position. In the early 1540s, Spain began receiving enormous flows of silver from the New World, which became an important source of revenue for the crown. But silver revenues proved unstable, creating financial risks. In the lead-up to the 1575 crisis, there was a substantial drop in silver inflows, which aggravated the crown’s financial difficulties. When Philip II faced the need to finance military campaigns and silver revenues fell short of expectations, the king could not service his short-term debts. This led him to suspend debt payments, causing the default of 1575. That crisis became a harbinger of the decline of the Spanish Empire, despite the continued growth of captured territories.
1584: succession crisis in France. 1583: the Throckmorton Plot, backed by Spain to overthrow Elizabeth I and elevate Mary Queen of Scots to the English throne, which contributed to the deterioration of relations between the Spanish Empire and the rising British Empire. 1585: Philip II imposed an embargo on all English goods in Spain.
1587: crisis in England’s export trade and the execution of Mary Queen of Scots, who had been intended for the English throne. This set the stage for the Spanish Armada’s attack on Britain, which ultimately took place in 1588.
1594: the start of the Franco-Spanish War.
1602 (1603): the death of Queen Elizabeth I, which led to the accession of James VI of Scotland (James I of England). This created tensions between the crown and parliament, one of the precursors to the English Civil War. The Great Famine in European states was also occurring at this time.
1621: a new phase of the war between Spain and the Dutch, a continuation of the Eighty Years’ War. This worsened the situation in the Thirty Years’ War, which had begun in 1618, intensifying the general conflict between Catholic and Protestant powers and spreading tensions across Europe.
1629: Holy Roman Emperor Ferdinand II issued the Edict of Restitution, which aggravated religious and political conflicts within the empire and led to a further escalation of the Thirty Years’ War. A plague outbreak also occurred in Italy.
1638: Tulip Mania, which had begun in 1637. The first documented financial bubble on the Amsterdam exchange.
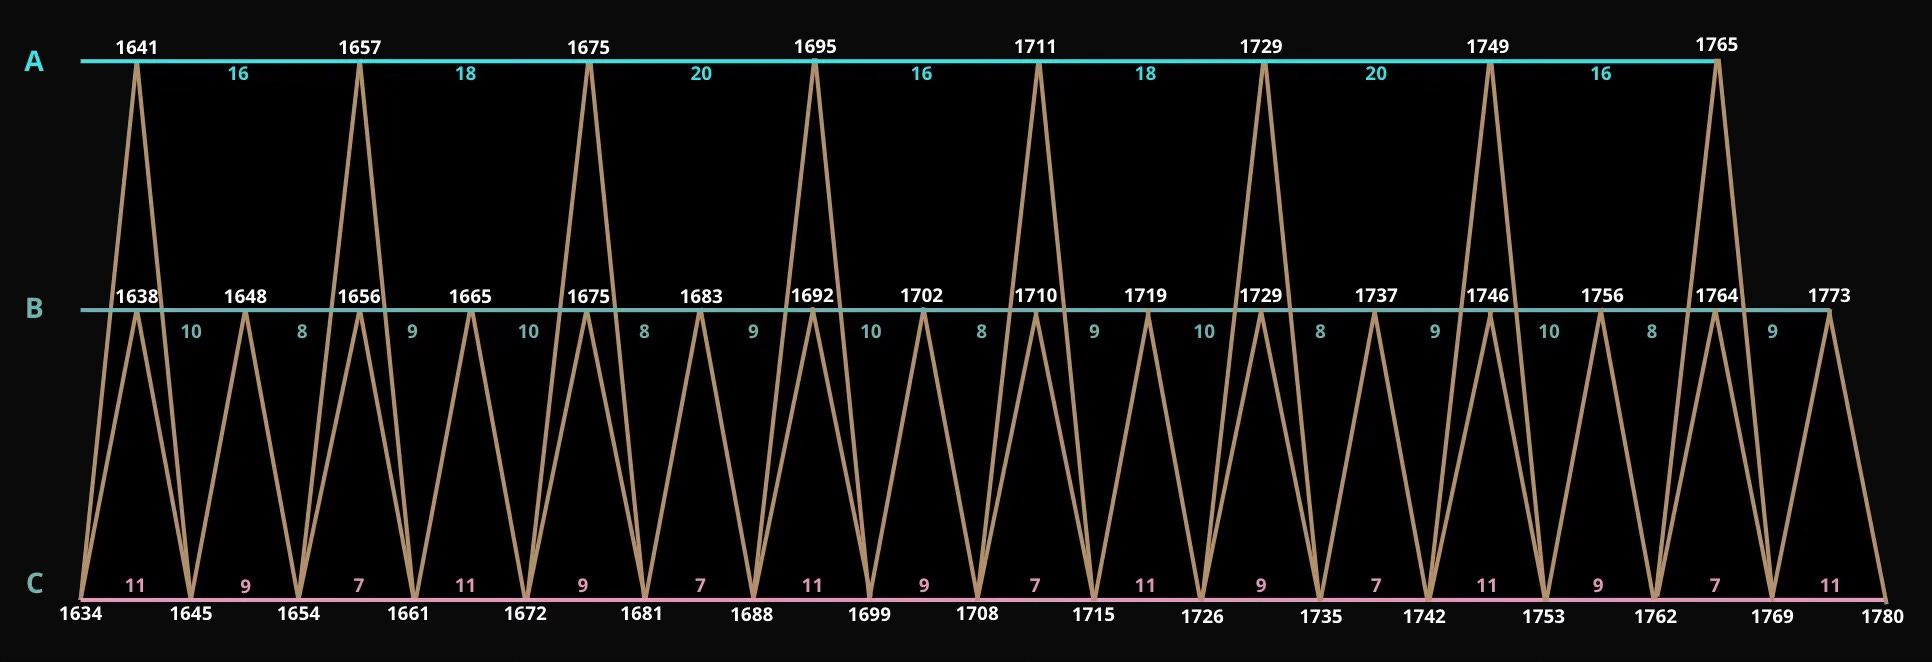
1641: parliamentary crisis, the English Monarchy, and civil war.
1648: the Peace of Westphalia, which ended the Thirty Years’ War and the Eighty Years’ War in Europe, bringing a shift in world order. The Holy Roman Empire lost influence. This also created economic problems for Spain, along with a transition into a period of debt crises and decline.
1656 (1657): plague epidemic in the Kingdom of Naples. Default on debts in Spain, after which the French began winning their wars.
1665: plague epidemic in London, the second wave of plague, which severely disrupted the economies of England and Europe as a whole.
1675: King Philip’s War in New England. A conflict between Native Americans and settlers in New England.
1683: the Liberation of Vienna from the Ottomans at the Battle of Vienna. This event ended the Ottoman threat to Europe, significantly altering Europe’s political and economic landscape and increasing the influence of the Austrian Empire.
1692: the year before the Battle of Marsaglia in 1693 (against Austria) and Neerwinden (against England, the Dutch Republic, and Spain), where France won but exhausted all its resources.
1695: prolonged famine in Scotland. Poor harvests in 1695, 1696, 1698, and 1699, combined with the economic downturn caused by the Nine Years’ War, led to severe famine and population decline. This tragedy coincided with the Great Famine in Estonia, Finland, Latvia, Norway, and Sweden.
1702: War of the Spanish Succession.
1711 (1710): France, under the rule of Louis XIV, was experiencing economic decline, partly due to the costs of wars. Crisis in Anglo-Scottish relations. Agricultural losses in Great Britain as a result of the Great Frost of 1709.
1719: the Mississippi Company stock bubble in France. It became one of the most famous financial bubbles of the 18th century, leading to a large-scale financial collapse. It coincided with the South Sea Bubble in Great Britain. In 1720, a plague outbreak occurred in France.
1729: famine, currency devaluation, and growing tensions between Catholics and Protestants in Ireland, aggravated by severe trade restrictions imposed by England, leading to further poverty and mass emigration.
1737: an inaccuracy, no significant upheavals occurred. Only in 1738 was there a harvest crisis in Scotland.
1746: the Battle of Culloden, which had long-term consequences for Scotland and Great Britain. During this same period, the War of the Austrian Succession continued in Europe, shaping the political and economic situation across the continent.
1756: the Seven Years’ War, which engulfed much of Europe, as well as colonies in America and Asia. In essence, the first global war.
1764 (1765): the Sugar Act, aimed at tightening control over the trade in sugar and other goods, which created tensions between the colonies and the metropole. The end of the Seven Years’ War in 1763 also increased the debt burden of the participating states.
1773: crisis in Great Britain following the Bengal Famine. The Boston Tea Party, a protest by American colonists against the tea tax imposed by the British Empire. This event became the catalyst for the beginning of the American struggle for independence. The collapse of the East India Company.
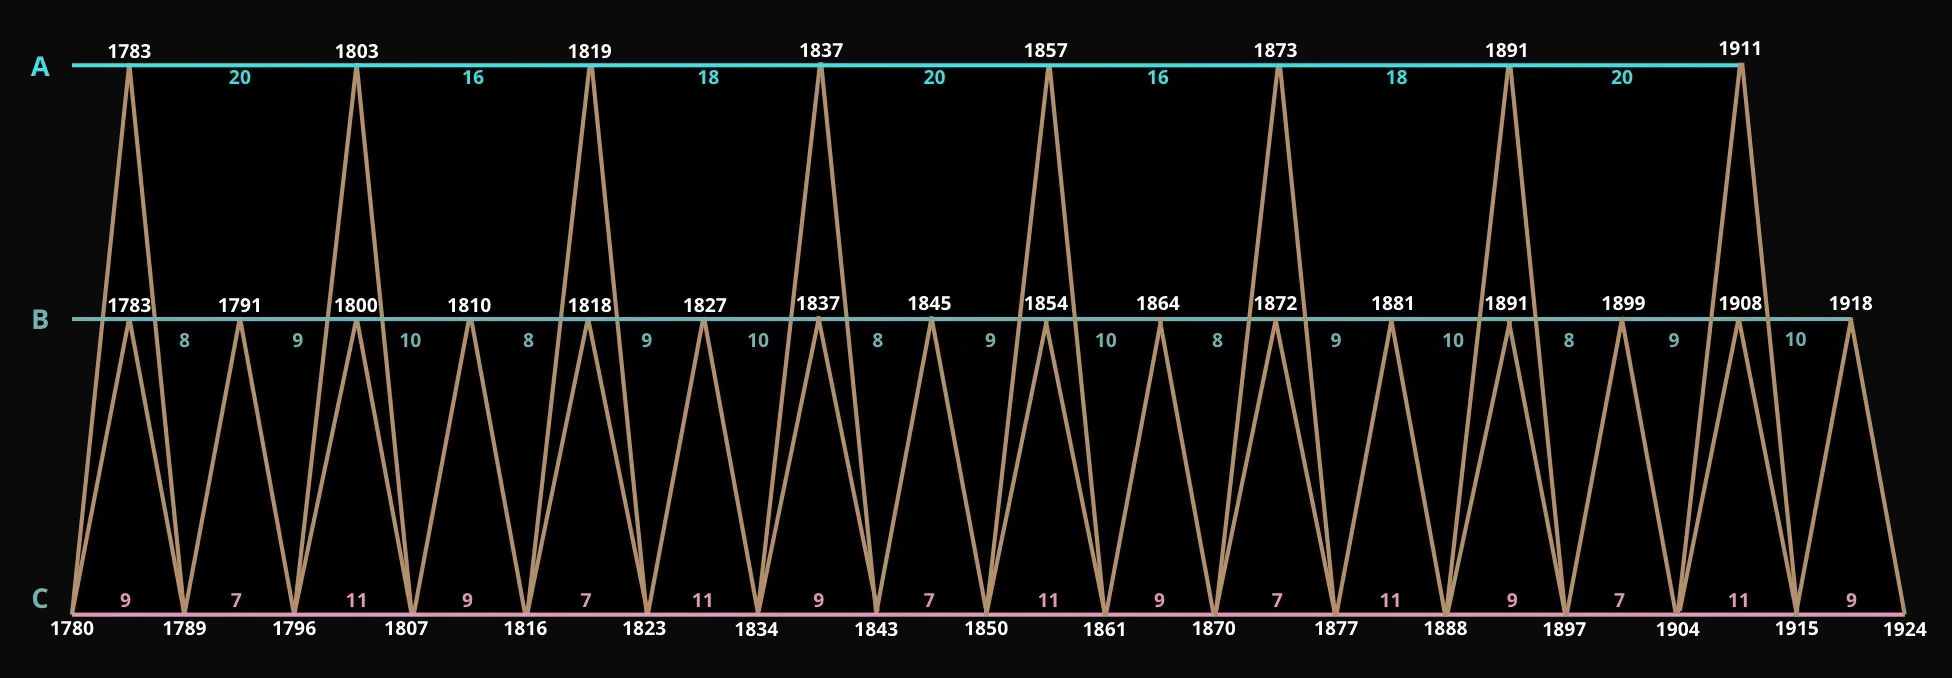
1783: the American Revolution. Great Britain lost control over its colonies in North America, reducing its revenues.
1791: the year before the Panic of 1792, the first major financial crisis in the young American republic, and the War of the First Coalition.
1800 and 1803: recession in the U.S., which followed the Peace of Amiens, ending the war between Great Britain and France. Commodity prices fell sharply. Trade was disrupted by pirates, which led to the First Barbary War. Soon after, Great Britain and France entered a new phase of the prolonged Napoleonic Wars.
1810: a sharp economic crisis in Great Britain, caused by overproduction and speculation linked to trade with America and the colonies. Two years later, in 1812, a brief recession in the U.S. preceded war with Great Britain.
1819 (1818): a panic that became the first major depression in U.S. history. It was caused by excessive credit expansion and land speculation, which led to the collapse of many banks and businesses.
1827: the year before the recession of 1828-1829, which was a precursor to the great depression of the 1830s.
1837: panic, financial crisis in the U.S.
1845: the Mexican-American War, the Great Irish Famine, a subsistence crisis in Europe, a late recession in the U.S.
1854: the Crimean War. Recession in the U.S. in 1854-1855.
1857: panic in the U.S. following the collapse of Ohio Life Insurance and Trust Company.
1864: the period of the American Civil War, collapse of the Indian stock market. The year before the recession of 1865-1867 in the U.S.
1873 (1872): panic that began in the U.S. and spread to Europe, a result of speculation in the railroad sector and a sharp contraction of the credit market.
1881: the end of major Native American resistance to U.S. authority. Britain’s defeat in the Anglo-Boer War, leading to the founding of the South African Republic. The year before the depression of 1882-1885 in the U.S.
1891: panic in the U.S. occurred in 1890, 1893, and 1896.
1899: recession in 1899-1900, connected to the start of the Second Anglo-Boer War. Two years later, the Panic of 1901 and another recession.
1908: period of recession in the U.S. (began in 1907).
1911: Antitrust crisis, Panic of 1910-1911.
1918: the Spanish flu and economic hardship following the end of World War I.
As the data was traced back into the distant past, the gradual transformation of global economic processes became evident. Where modern crises have a universal scale, earlier historical events were more localized, affecting individual empires and civilizations without exerting a total impact on the world economy, only on specific geopolitical regions.
A few charts reflecting the state of economies in the past: a wholesale price index for commodities and the level of international investments as a percentage of developed world GDP.
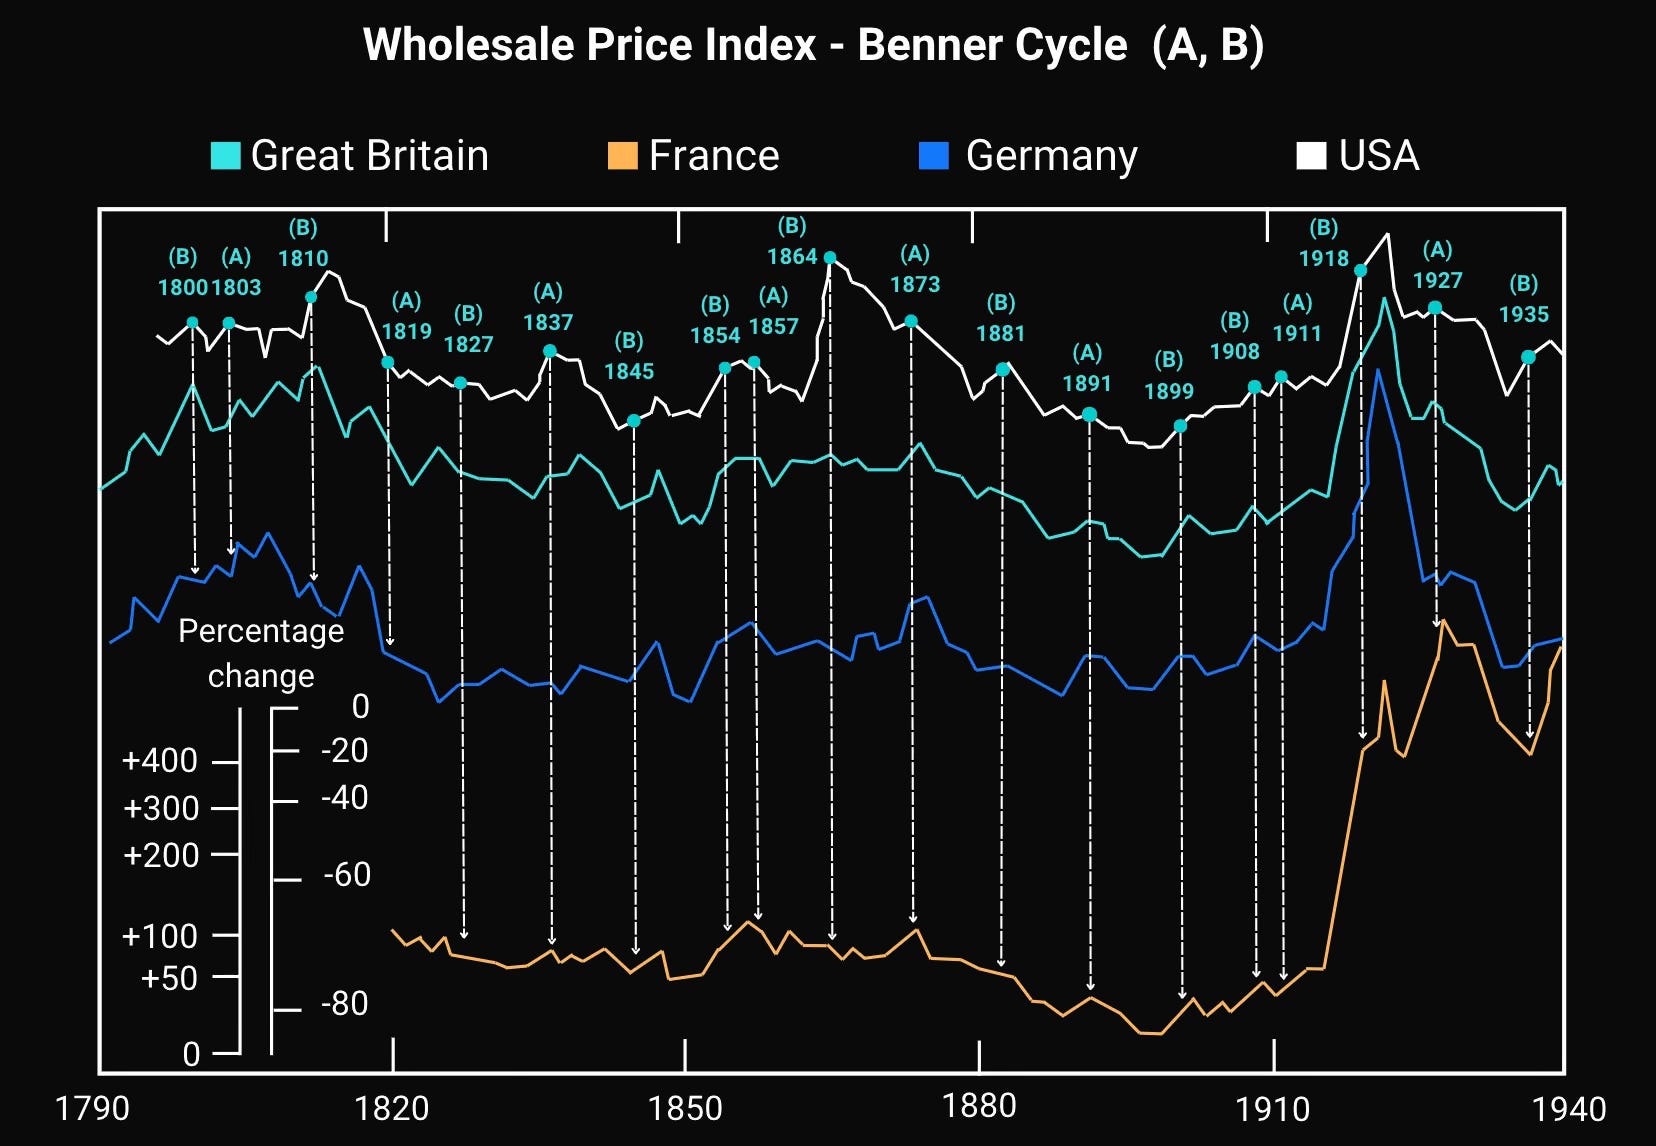
The peak of the wholesale price index aligned quite accurately with Benner’s high-price years, A and B. Discrepancies appeared only in 1819, 1845, and 1899, but each of those periods was defined by wars or panics.
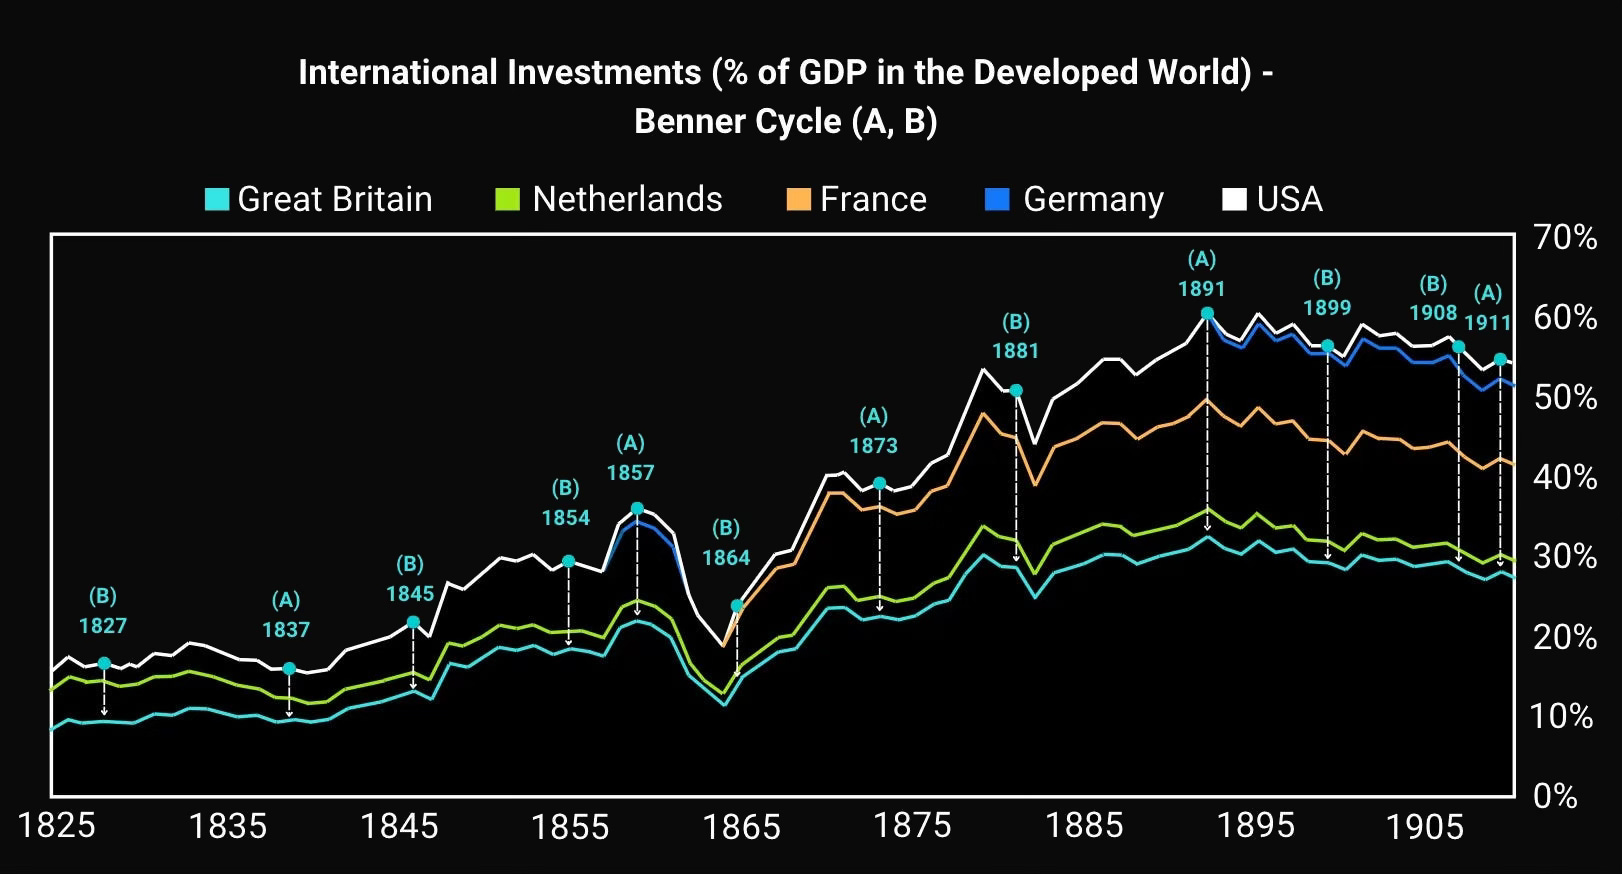
The same pattern holds for international investment levels in the 19th century. The one exception is 1864, which negatively correlated with wholesale prices, particularly in the U.S. That price decline was connected to the Confederate currency reform of 1864, carried out to shrink the money supply during wartime. At the same time, the industrial revolution was generating significant investment flows.
Recent Past
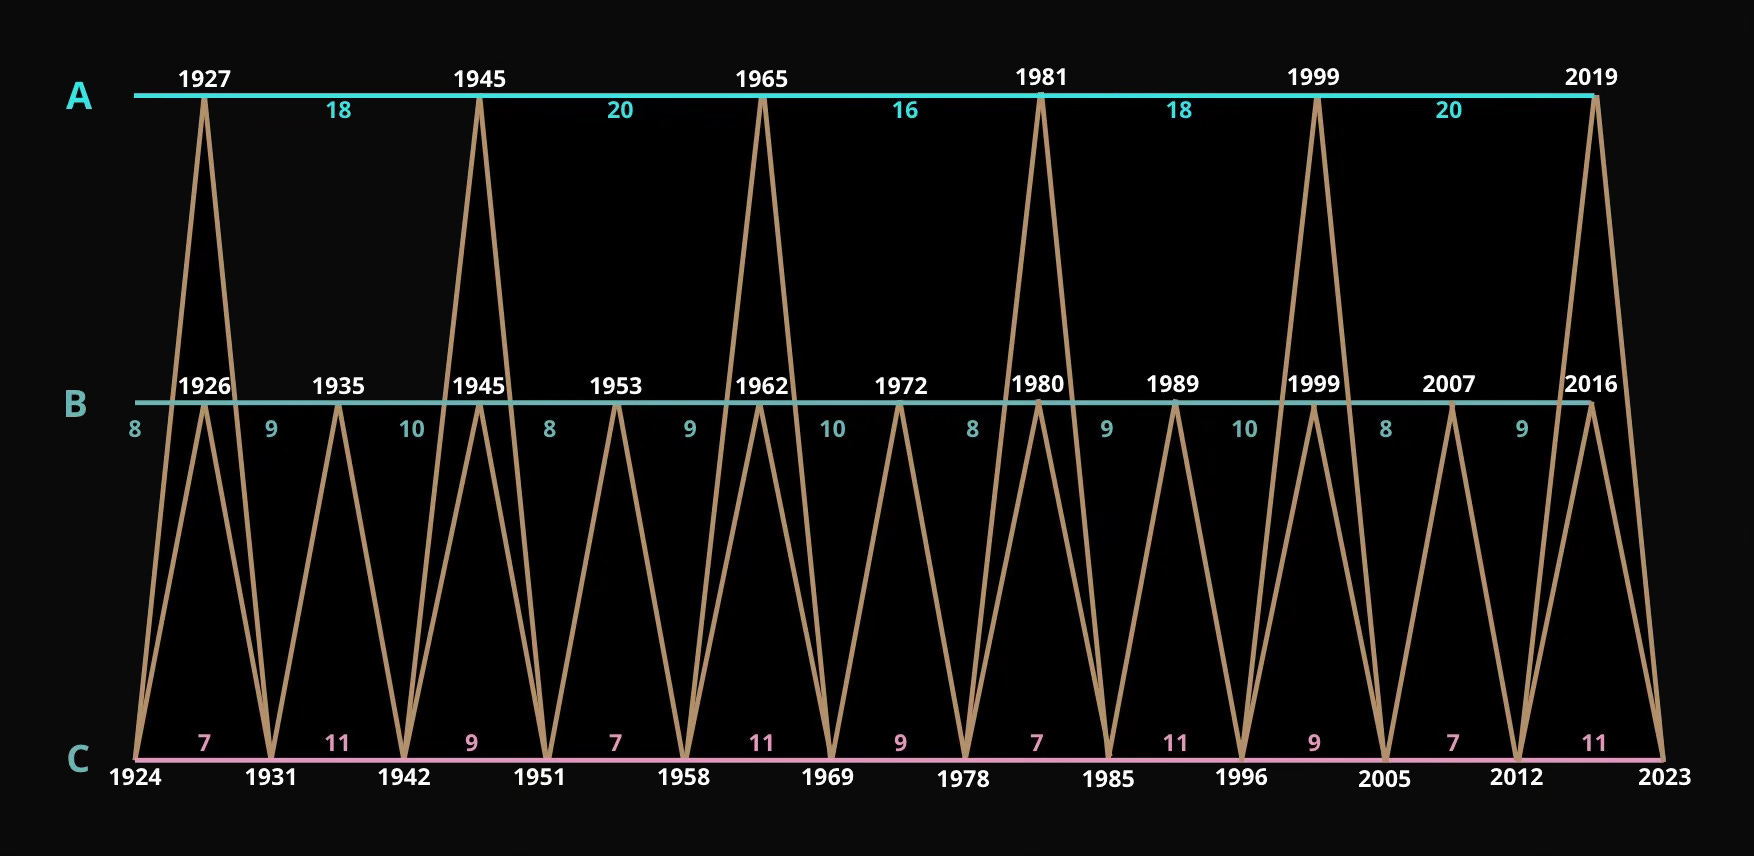
1926 (1927): recession in the U.S.
1935: a two-year miss. The recession in the U.S. began in 1937.
1945: the aftermath of World War II, recession.
1953: recession in the U.S., caused by reduced spending after the Korean War.
1962: the Cuban Missile Crisis.
1965: the beginning of large-scale U.S. military operations in Vietnam and increased war spending.
1972: collapse of the Bretton Woods system (December 18, 1971). Then 1973: the energy crisis.
1980 (1981): recession in the U.S.
1989: the end of the Cold War, the year before the U.S. recession. Collapse of the Japanese stock market following the peak of the speculative real estate and equity bubble.
1999: the year before the dot-com bubble.
2007: the year before the mortgage crisis.
2016: Brexit.
2019: the COVID-19 epidemic.
Recent events draw the most attention, as the current generation is familiar only with the crises of 1999, 2008, and 2019, each of which was identified by Benner back in 1875. All of these events have led us to the current troubled state of the global economy.
The Future
Benner’s Cycles can also be extrapolated into future years to identify potential crisis periods.
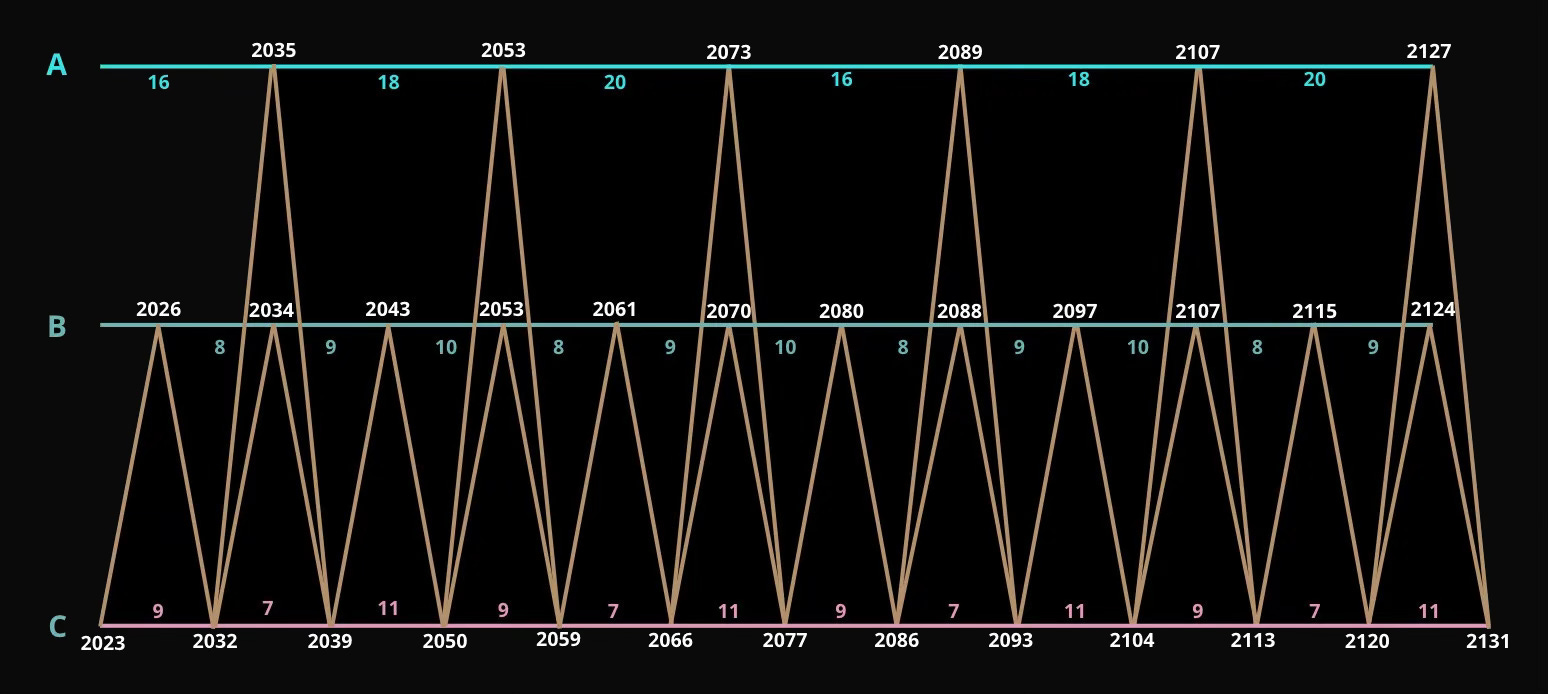
The nearest peak is projected for 2026, after which a crisis becomes a possibility. The list of potential risks for such a scenario is extensive.
An escalation of trade wars between major economies and the spread of protectionist tendencies, which would disrupt global supply chains, will affect the volumes of international trade and investment. Existing geopolitical conflicts, for example in the Middle East or Ukraine, could play an equally destabilizing role if they intensify, as could the emergence of new flashpoints.
Looking further out, the rapid spread of automation and artificial intelligence also poses a risk, as it could trigger mass layoffs, particularly in knowledge-work sectors. Alongside this, the heavy debt loads of governments need to be taken into account, as do demographic shifts: the aging of the baby boomer generation and falling birth rates. More retirees and fewer young working-age people in developed countries means a deeper government debt hole. These factors carry additional complications for healthcare and social welfare systems, whose financial positions are already in question.
The threat of external shocks linked to natural disasters, climate change, and epidemics remains, capable of destroying supply chains. And the financial bubbles that formed on the back of the AI boom and the COVID-era money printing could burst with equally dramatic consequences as they have before in stock market history. This is only the visible portion of the risks.
A combination of several of the factors listed above creates all the conditions for an economic downturn in the coming years. And even a freeze on military conflicts would be unlikely to positively affect the outcome.
The yield curve (the yield spread between 10-year and 2-year bonds) has historically often foreshadowed economic downturns. But the current situation is further complicated by the critical growth of U.S. government debt. Since 2020 it has increased by $13 trillion and reached $36 trillion (43% growth in four years). By 2034, it is projected to reach $57 trillion, though this forecast does not even include the probability of a recession.
The debt-to-GDP ratio has exceeded 121%, higher than the levels seen during World War II. The U.S. spends 17.9% of all federal revenues on debt service alone (the highest figure since 1993), due to high Fed interest rates.
Rate cuts would be a beneficial step, as they would reduce the yield on new bonds, lowering budget expenditures on debt payments. The government would be able to start buying back existing high-yield bonds, replacing them with new bonds at lower interest rates, which would allow current debt to be refinanced on better terms.
With further rate cuts, the gap between short-term and long-term bonds will begin to narrow. 2-year and 10-year bonds will gradually return to their normal configuration, where long-term yields exceed short-term yields. The paradox is that these actions typically coincide with the start or peak of a recession: they don’t prevent it, they help soften the consequences and accelerate economic recovery. The closed loop of Fed policy will lead to further weakening of the dollar and the American economy, which will aggravate political and economic instability going forward.
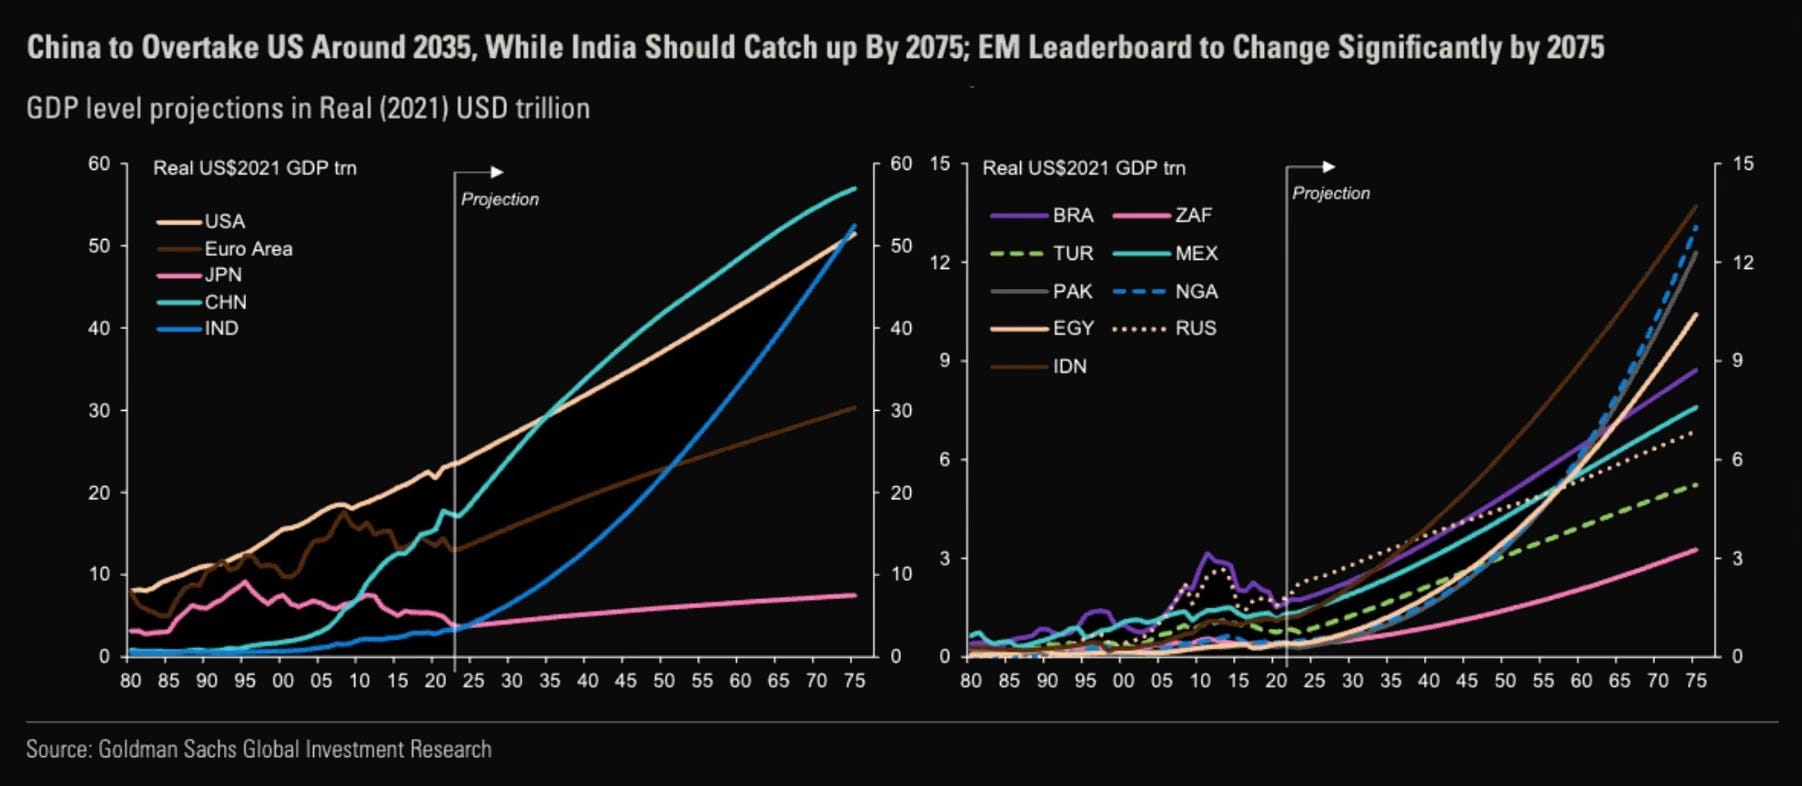
The more distant outlook is no less grim, even looking at the forecast for the world’s largest economies through 2075.
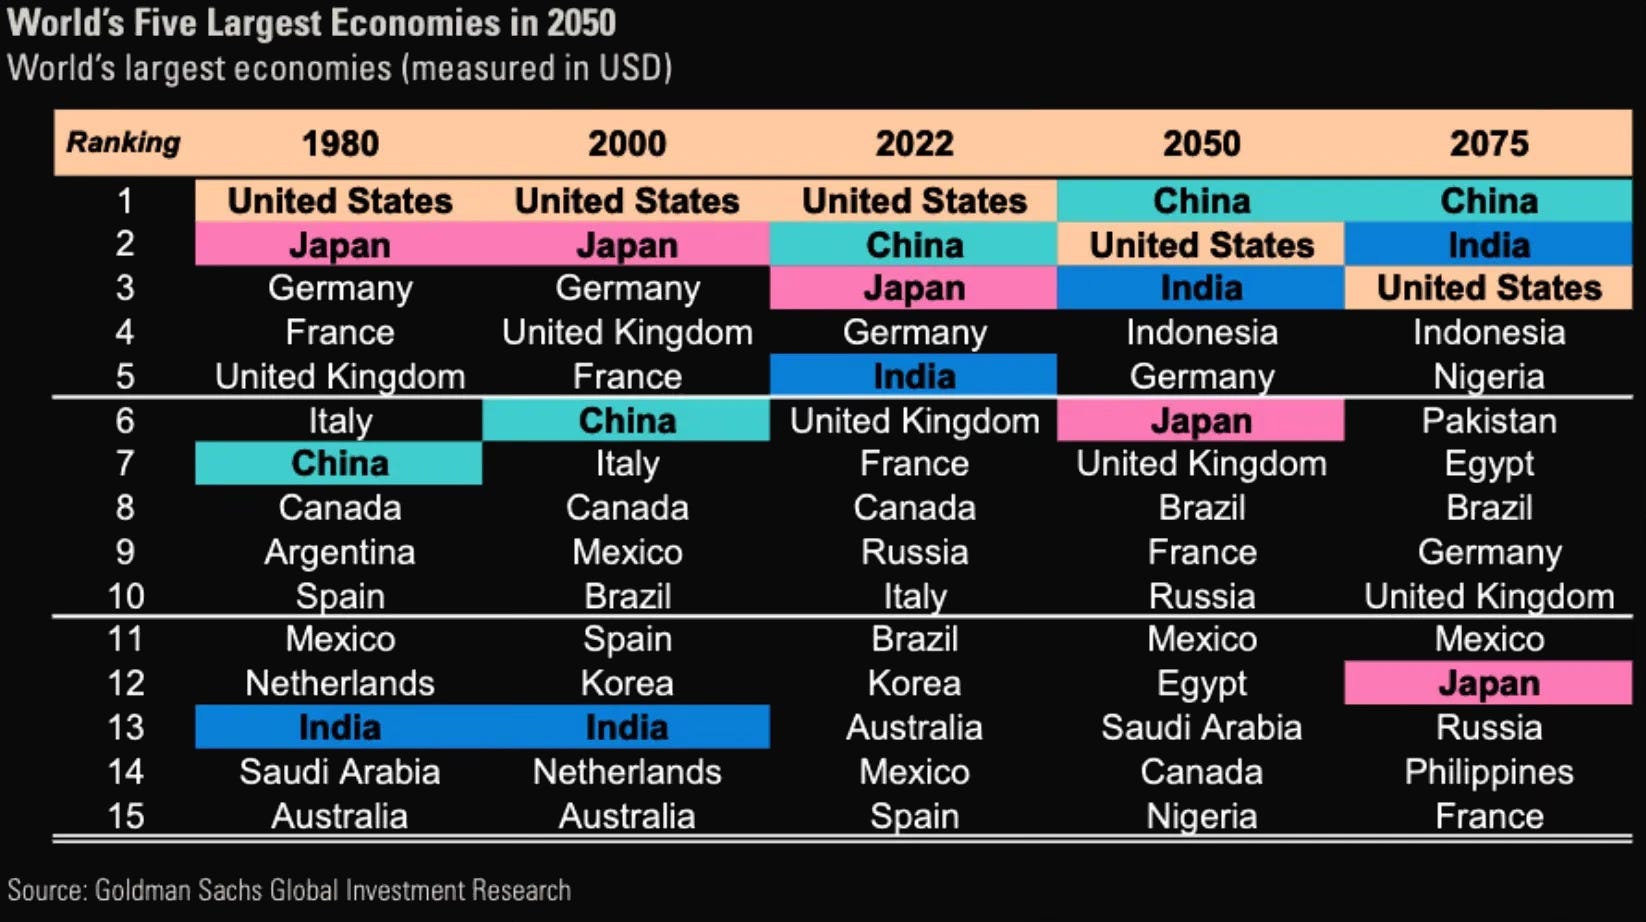
According to Goldman Sachs estimates, China will overtake the U.S. around 2035, while India should catch up to China by 2075. The potential growth rate in the U.S. is significantly lower than in major developing economies, including China and, especially, India, where demographic growth plays an enormous role.
Shifts of this magnitude in the world order have always been accompanied by major wars. As far back as 2016, the Atlantic Council identified several plausible military conflicts that could occur (some are already in progress).
West and Russia. Tensions between Russia and the West, particularly in the context of Ukraine, will lead to military conflicts in the post-Soviet space and Eastern Europe.
East Asia. China is actively building up its naval and conventional forces, substantially altering the regional balance of power. The military expansion affects the strategic interests of U.S. allies in the region, including Japan, Taiwan, Vietnam, Malaysia, the Philippines, and South Korea. Beijing’s growing ambitions call into question the U.S. ability to guarantee the security of its partners and create a new geopolitical reality with potential conflicts.
South Asia. The conflict between India and Pakistan carries the greatest risk of going nuclear. The Kashmir problem remains the single biggest obstacle in bilateral relations between these two countries. Pakistan, lacking a clearly formulated nuclear doctrine, follows a first-strike principle (unlike India, which has declared it will not be the first to use nuclear weapons). Given Pakistan’s posture, any direct confrontation with India could trigger a nuclear war.
Middle East. Continuing instability in Syria, Iraq, Iran, Libya, and Yemen could lead to further spread of conflicts, including clashes between Sunnis and Shias.
Central and East Africa. A growing number of conflicts between Muslim and Christian populations could lead to violence in countries such as Sudan and Nigeria.
But all wars are fought over specific material assets: territory, natural resources, transportation corridors, and economic holdings. When economic disputes between countries reach a critical point and diplomacy stops working, the military mechanism for redistributing property and zones of influence kicks in. Every war is a pragmatic calculation, where the winner is whoever controls more valuable economic assets and has greater military capacity to seize them. The probability is high that the coming cycles will bring new wars and changes in world order.
Cyclicality Is Not a Strategy
At first glance, the logic seems simple: following Benner’s variations, buying during economic downturns (C) and selling during upturns (A and B) appears to be a winning strategy. But after examining a significant body of evidence, it becomes clear that this investment approach guarantees not profit, but at best the preservation of capital.
Financial analyst Vasco Laranjo conducted his own analysis of three strategies based on Benner’s Cycles.
Strategy 1. Buy during bad economic conditions (C) and sell during good conditions (B).
Strategy 2. Buy during bad conditions (C) and sell during panic years (A) and good conditions (B).
Strategy 3. Similar to Strategy 2, but adds another type of trade: short positions between periods A and C.
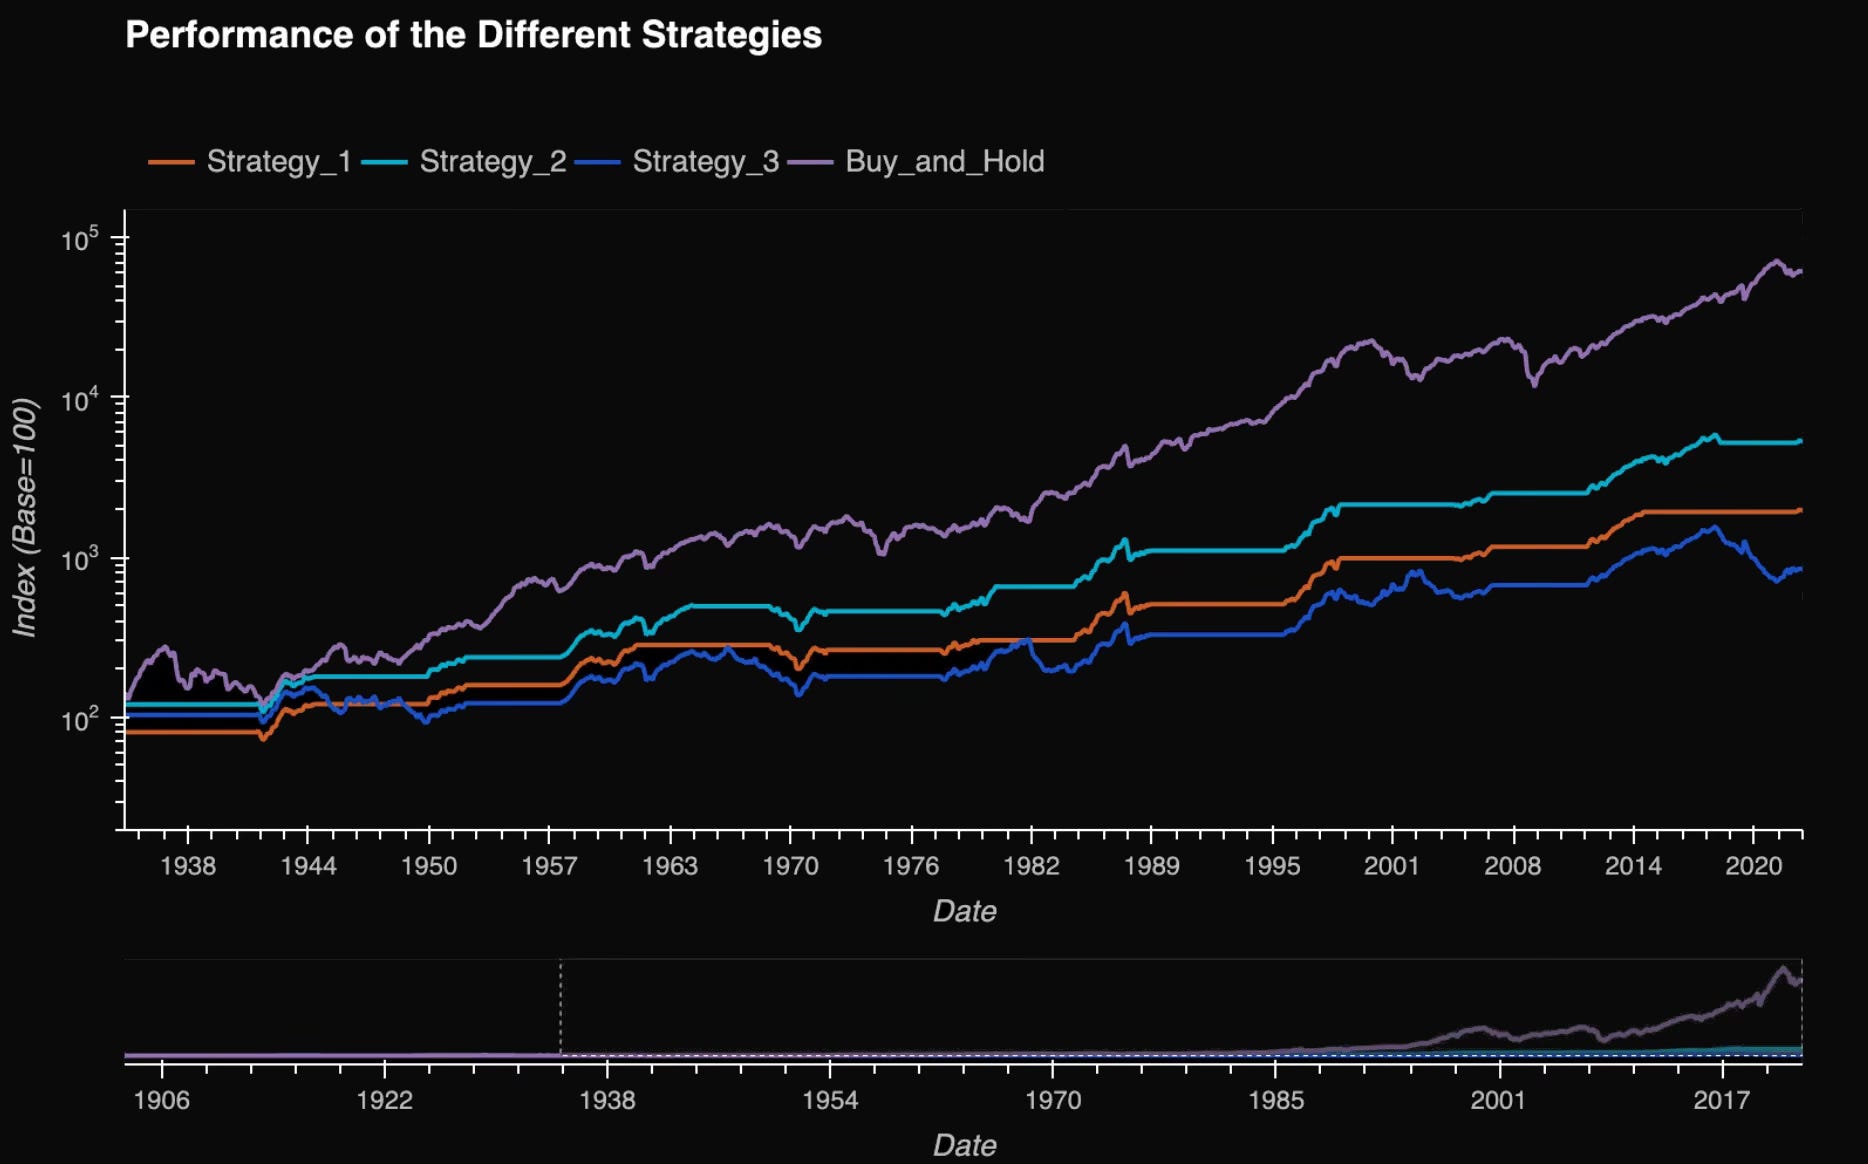
The research findings showed that among the three strategies tested, Strategy 2 demonstrated the most attractive return profile, managing to avoid losses. But its returns are significantly lower than the classic buy-and-hold strategy. This is confirmed by an independent backtest by Charles Edwards, conducted on Dow Jones Index data.
Despite the absence of clear losses, the practical application of cycles as a trading strategy comes with limitations. Using fixed dates for entering and exiting positions inevitably reduces potential returns, since real economic processes rarely align with the start of a year on January 1st. Low-price periods (C) are also characterized by significant uncertainty: a crisis can often be shorter than forecast, which makes buying exclusively during C periods questionable.
But the far more interesting topic for observation is periods A and B. When moving away from strict attachment to specific dates and toward analyzing peak prices in the corresponding years using the S&P 500 Index, Benner’s Cycles demonstrate fairly high accuracy.
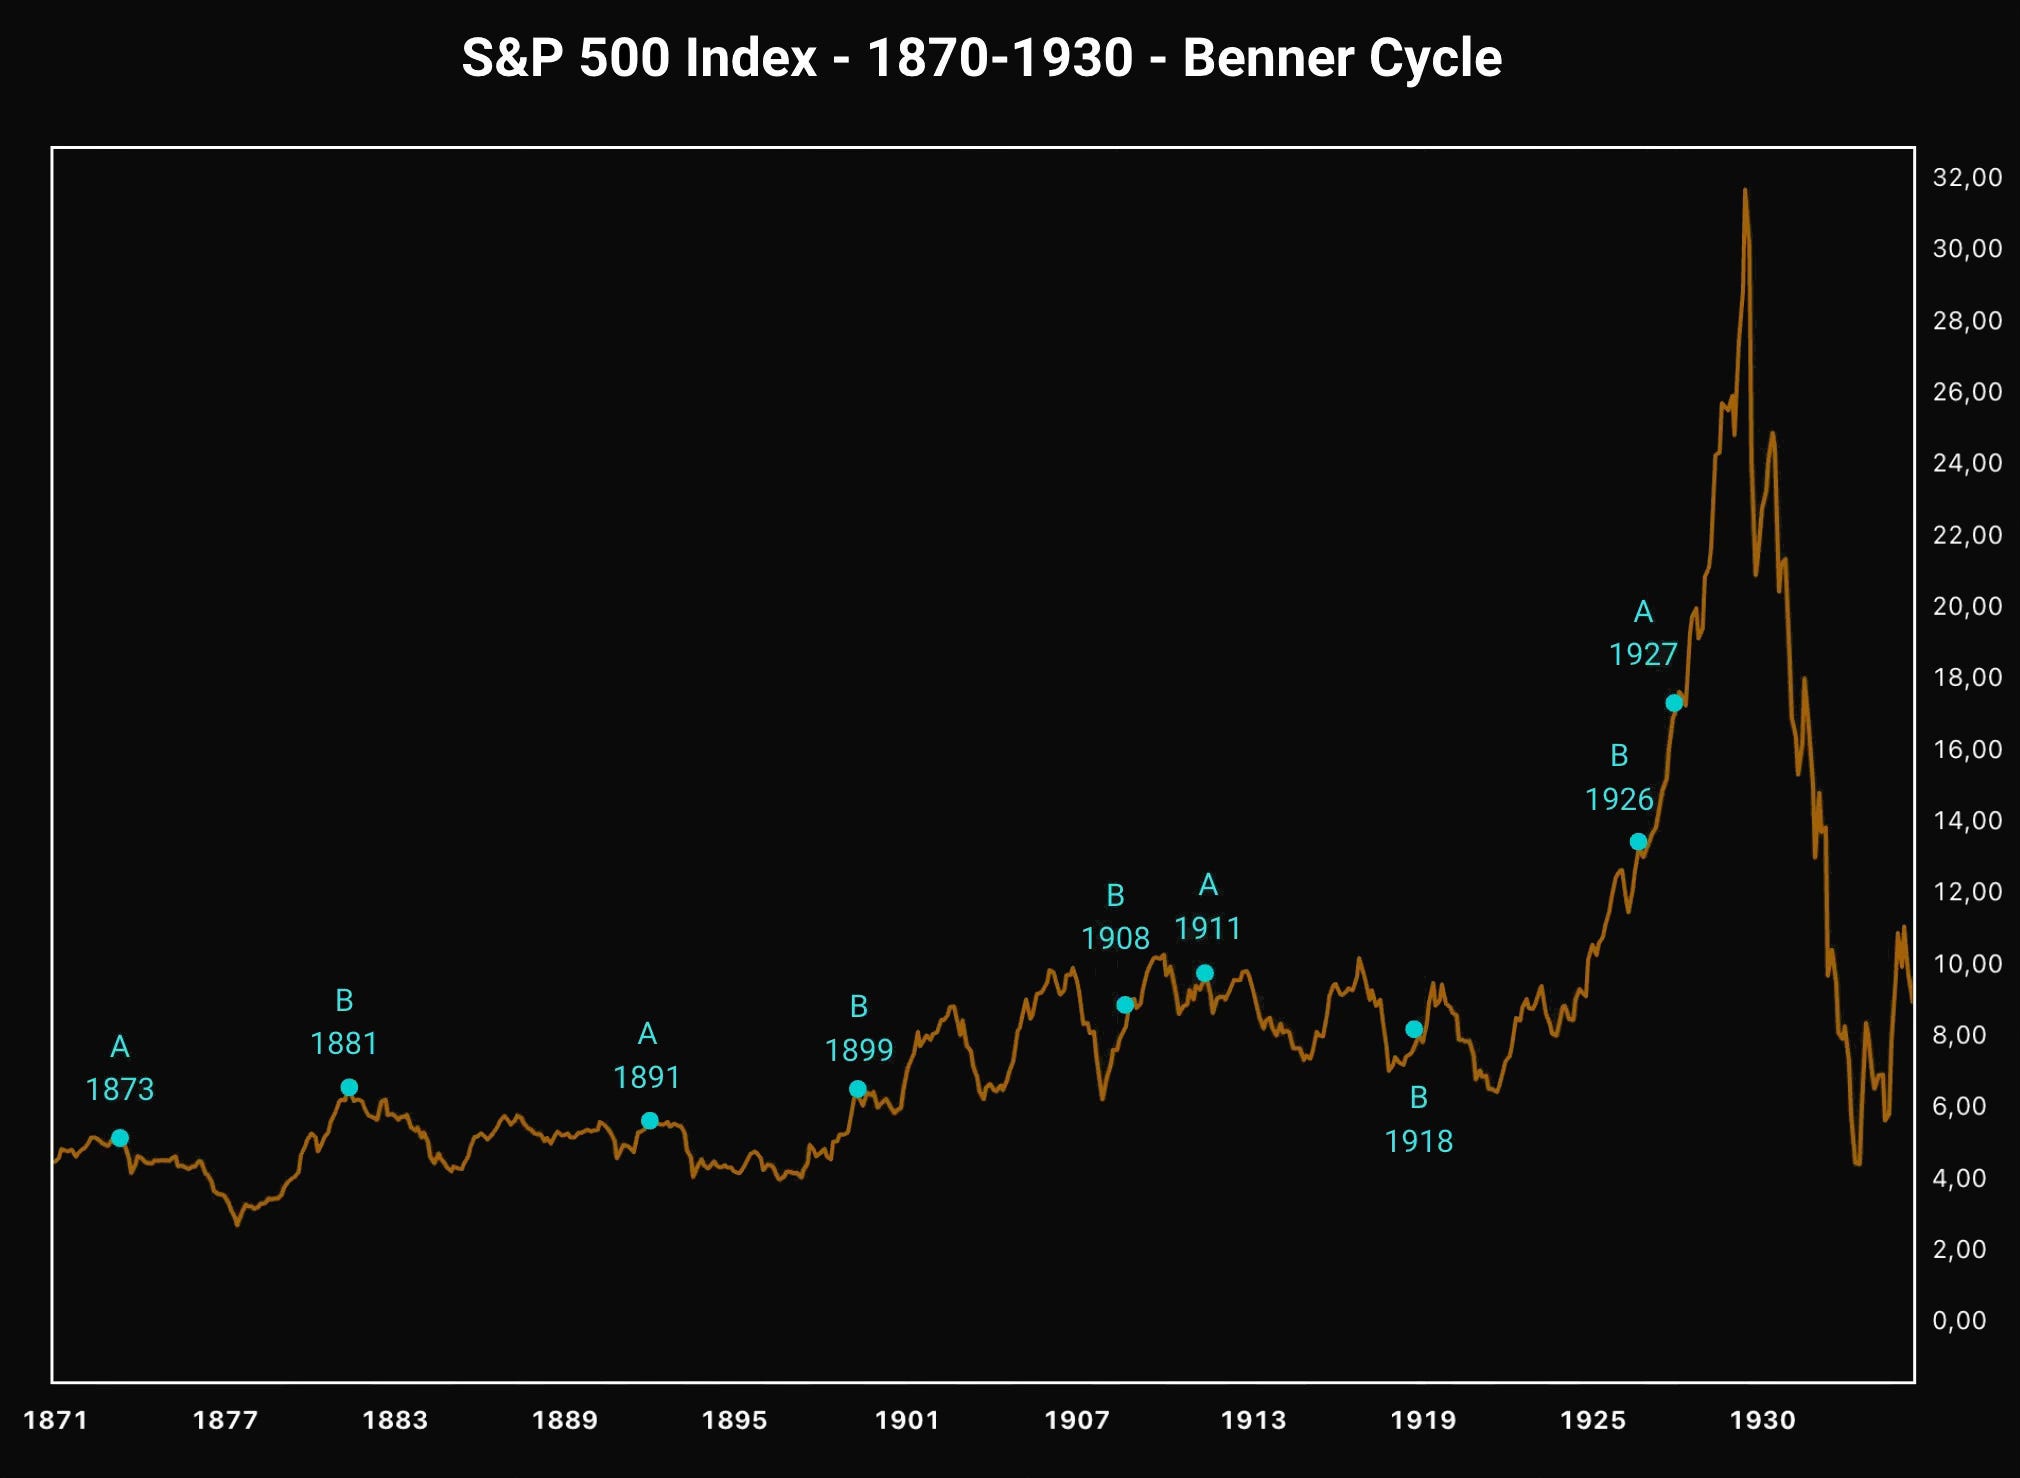
At first glance, 1927 might seem like a poor year, but adjusted for inflation, locking in profits during that period could have served as insurance for investors against the catastrophic losses of the Great Depression in the early 1930s. At the same time, the 2016 Brexit events, despite the scale of the political development, did not produce significant market upheaval.
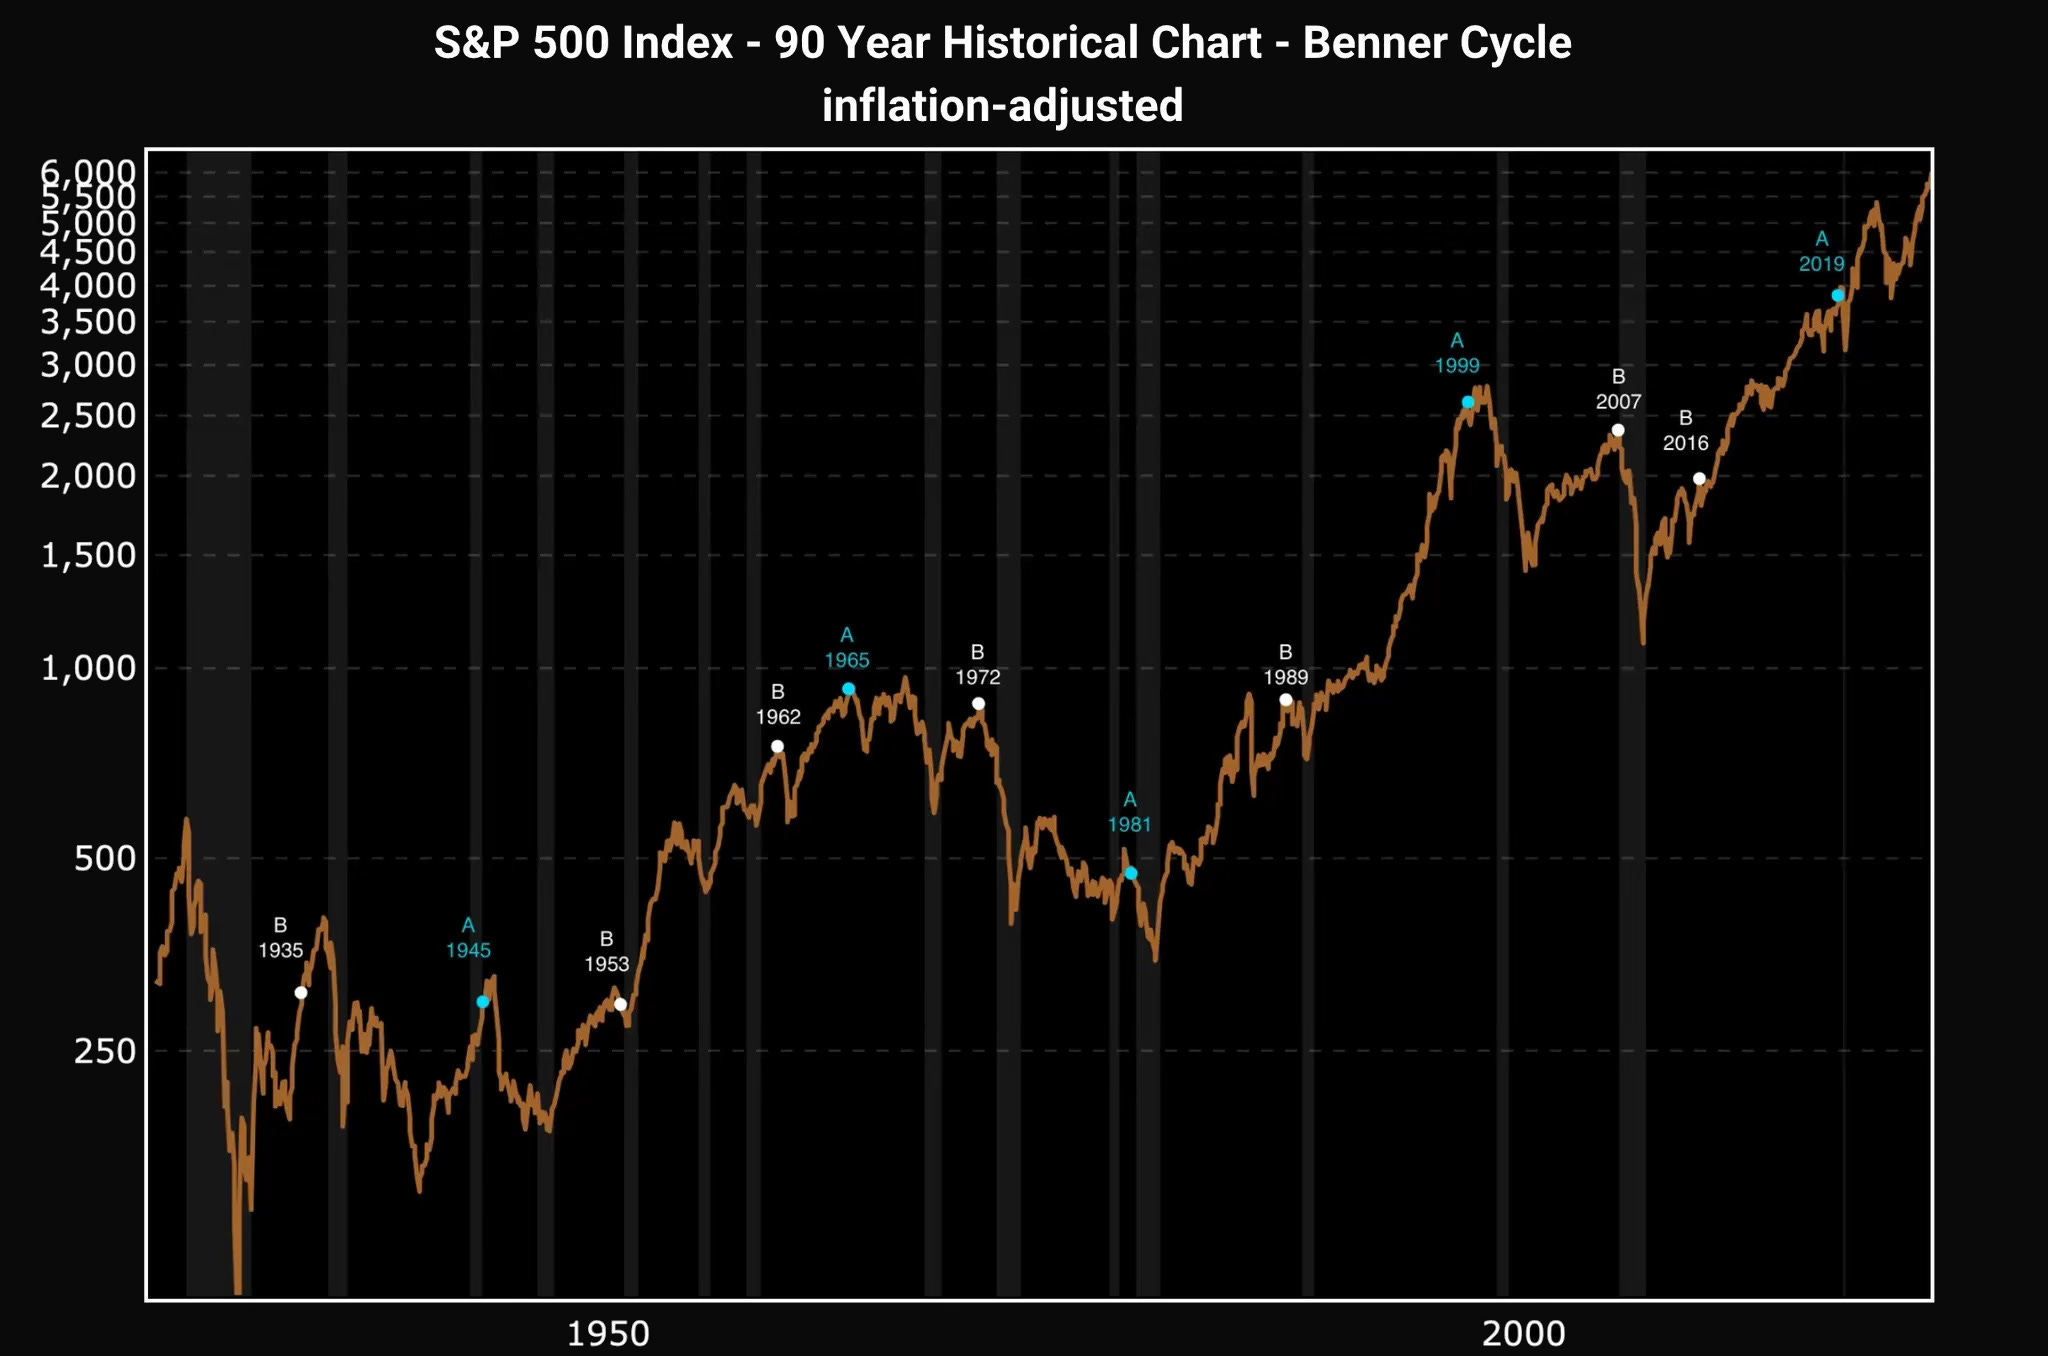
Benner’s Cycles essentially function as an indicator of elevated investment risk and clearly illustrate critical periods when purchasing financial assets becomes an extremely risky endeavor. A telling example: 1999. The popular buy-and-hold strategy in that case would have meant waiting approximately 15 years to return to breakeven.
But to truly appreciate Benner’s Cycles, one needs to go beyond the time frame of modern financial indexes. So let’s look at the reconstructed Dow Jones Index from 1789.
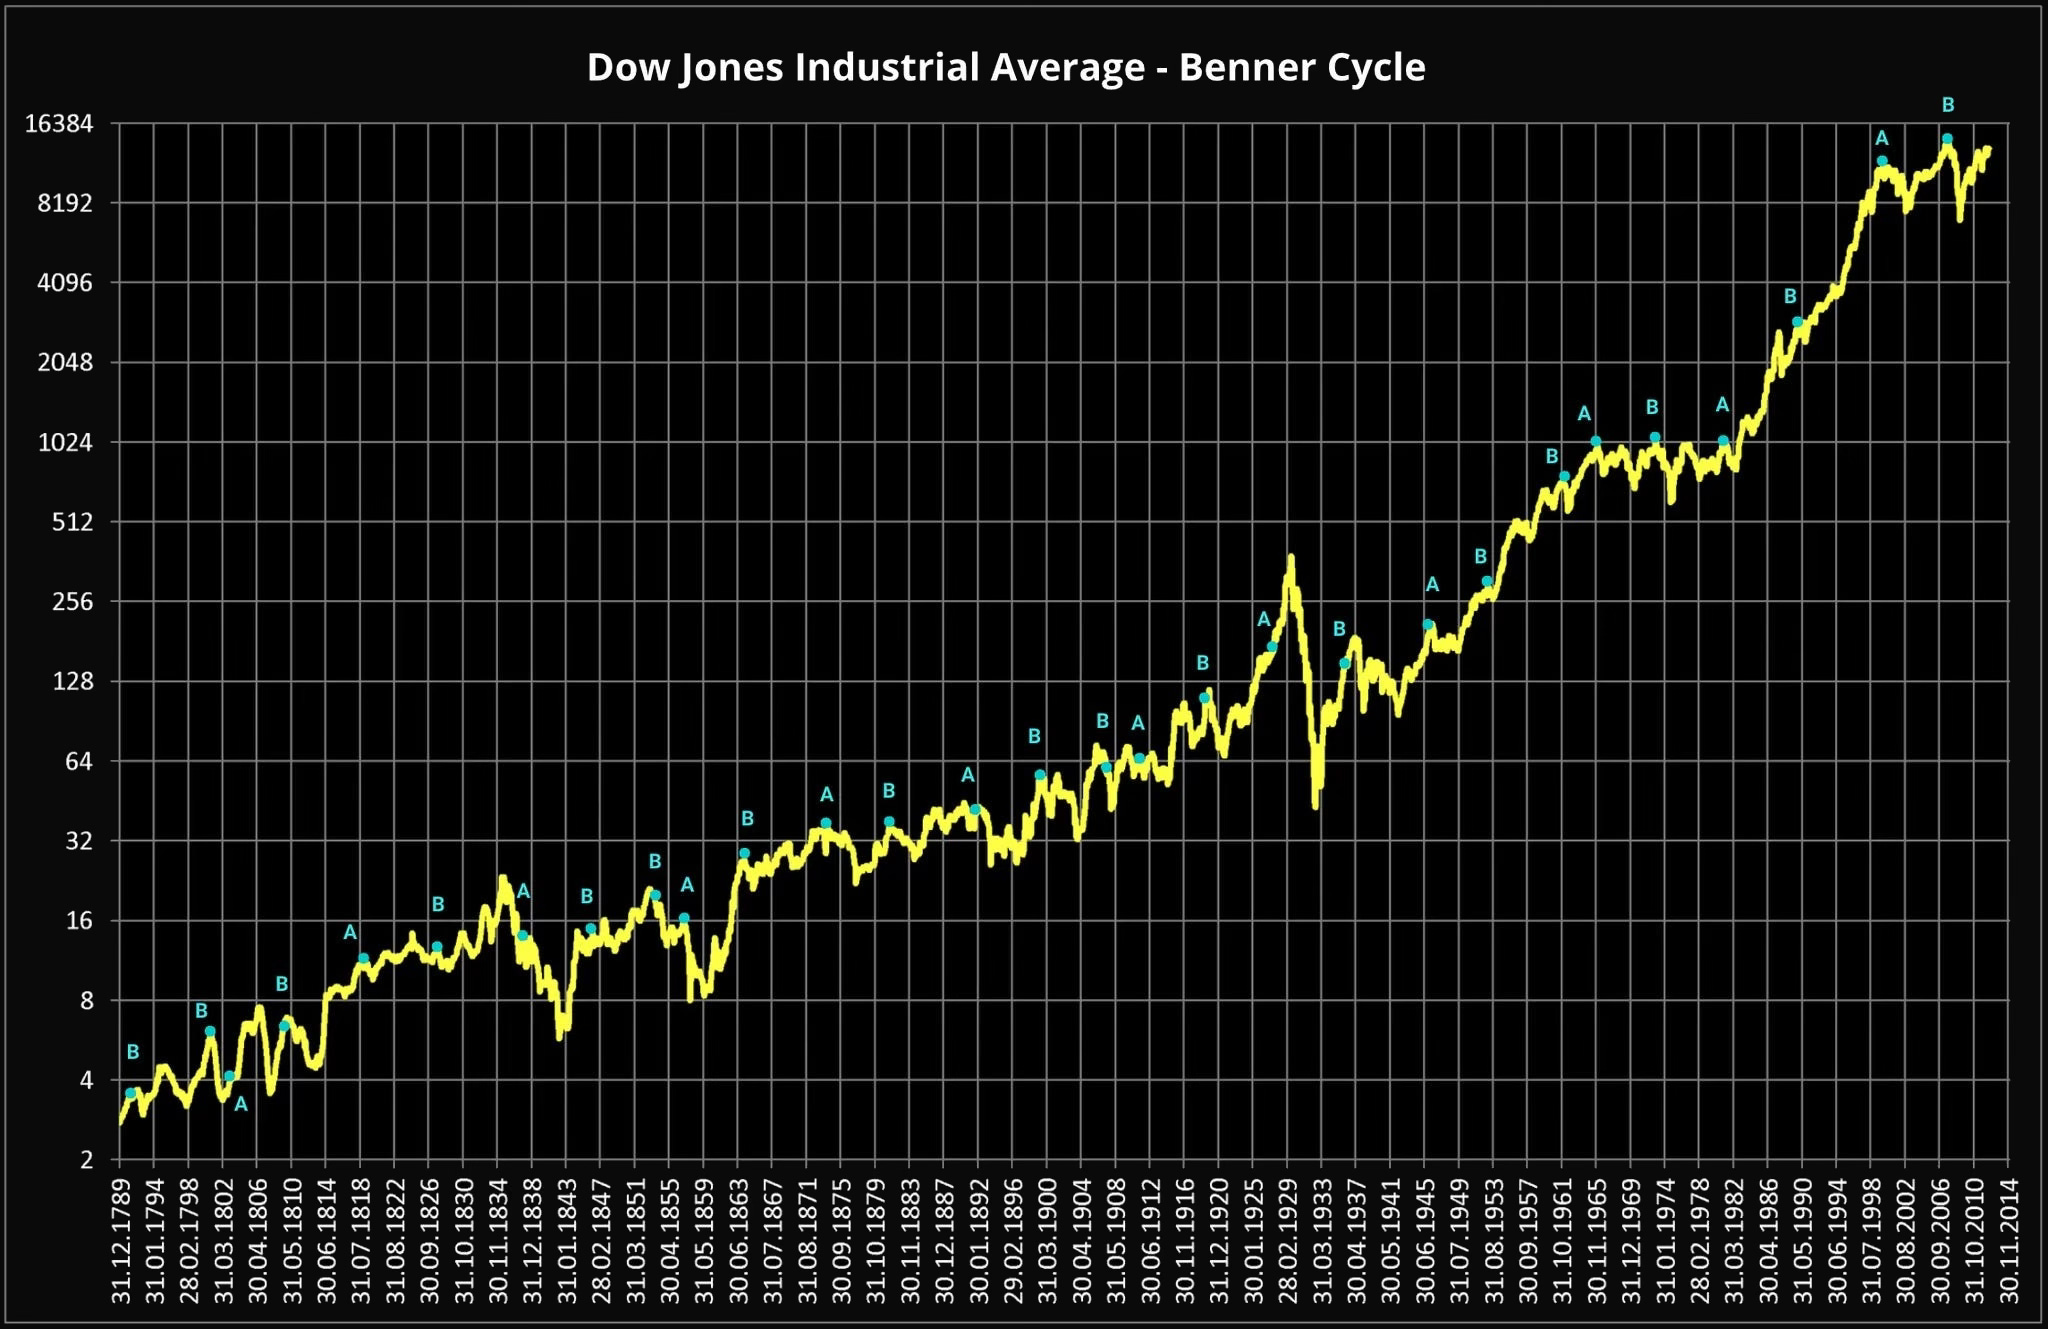
Peaks during periods A and B also align with many index peaks in line with economic events of the time, including the exception of 1803, the U.S. recession.
Findings
All of this work was done to assess the accuracy of Benner’s method. In most cases, years A and B do indeed signal a high probability of panic and a strong likelihood of crisis events.
Dow Jones Index: Alignment of Dow Jones peak with period A/B: 79.3%. Time period: 1803-2019.
S&P 500 Index: Alignment of S&P 500 peak with period A/B: 71.4%. Time period: 1873-2019.
Crisis events: Alignment of crisis events with periods A/B: 94.4%. Time period: 1575-2019.
I would interpret Benner’s Cycles less as a trading tool and more as an additional indicator of elevated risk, during which purchasing risky financial assets can lead to losses, while selling can reduce potential downside.
Conclusion
Samuel Benner was a pioneer in the study of market cycles. His work, which began as a personal search for answers after going bankrupt, resulted in one of the first models of market cyclicality. Today his ideas are not applied in mainstream financial market analysis, but the statistics show that cyclicality has not gone anywhere.
Although times have changed and the economy has grown more complex, the fundamental principles of periodicity that Benner laid out remain relevant.
 |
|