

Zoom Video Communications, Inc.
The company is actively investing in infrastructure and new technology to deliver more effective and innovative solutions to its users.

Some companies report financials on a fiscal year that doesn’t align with the calendar year. This comes down to deferred reporting or different reporting periods chosen in line with financial strategy and regulatory requirements. Zoom, Inc. is one such case.
Let’s start with how the company positions itself and what it produces. This can be found in the 10-K filing submitted to the SEC.
Reading through this, the infrastructure Zoom has built around its platform is extensive. It spans hardware, applications, and cloud storage designed to streamline workflows. The company is also actively integrating AI into its platform.
The shareholder discussions reviewed below further confirm the AI integration. This points to a deliberate strategic direction and the company’s ability to adapt to shifting user and market demands.
Zoom is actively investing in infrastructure and new technology to deliver more effective and innovative solutions to its users. For investors, that is a positive signal: innovation and product development can drive growth and competitive positioning.
But what do the financials actually look like? And why did the stock drop so sharply?
Financials Analysis
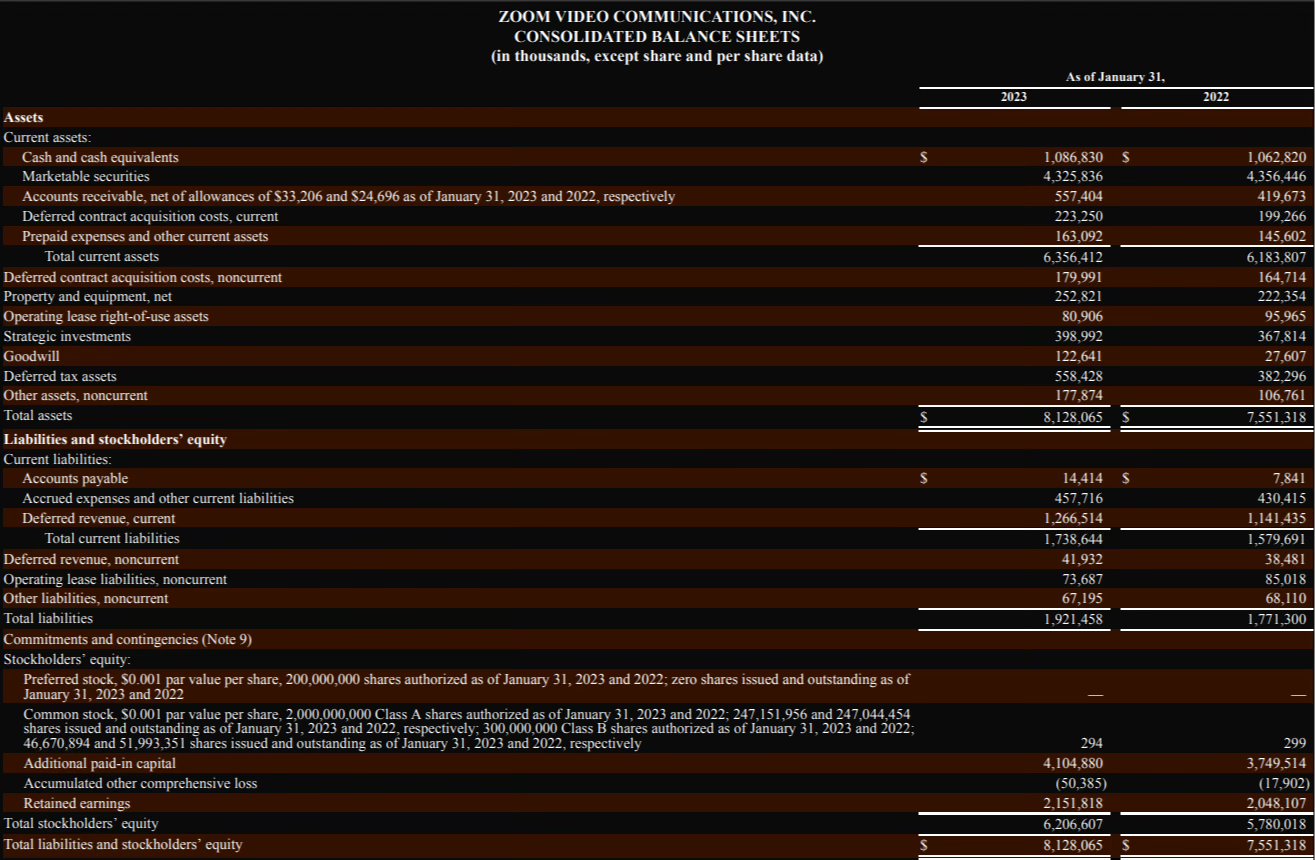
CONSOLIDATED BALANCE SHEETS
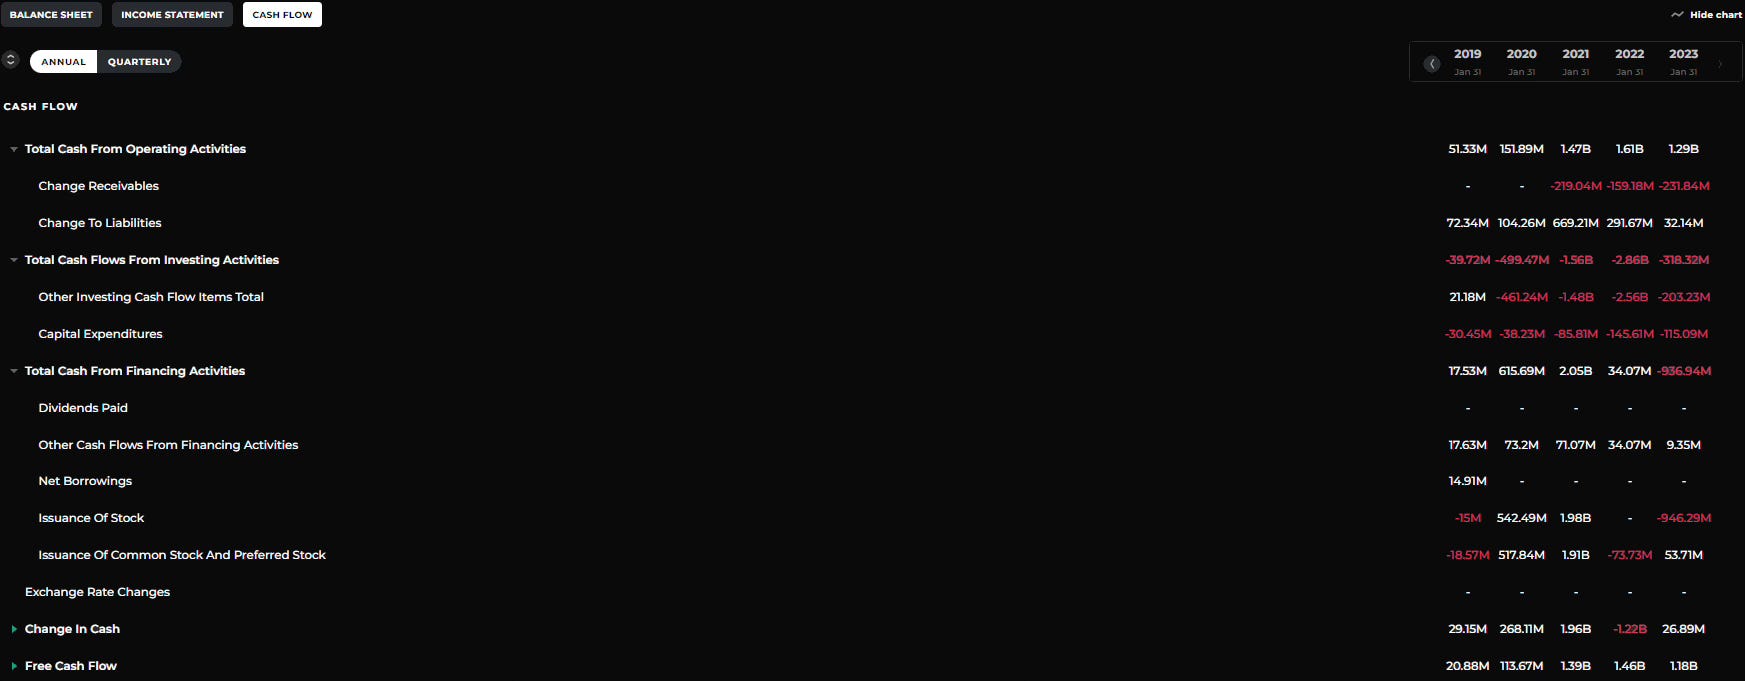
I’ll be reviewing all sections through SeekingAlpha. The numbers are the same, but SeekingAlpha shows seven years of history rather than two.
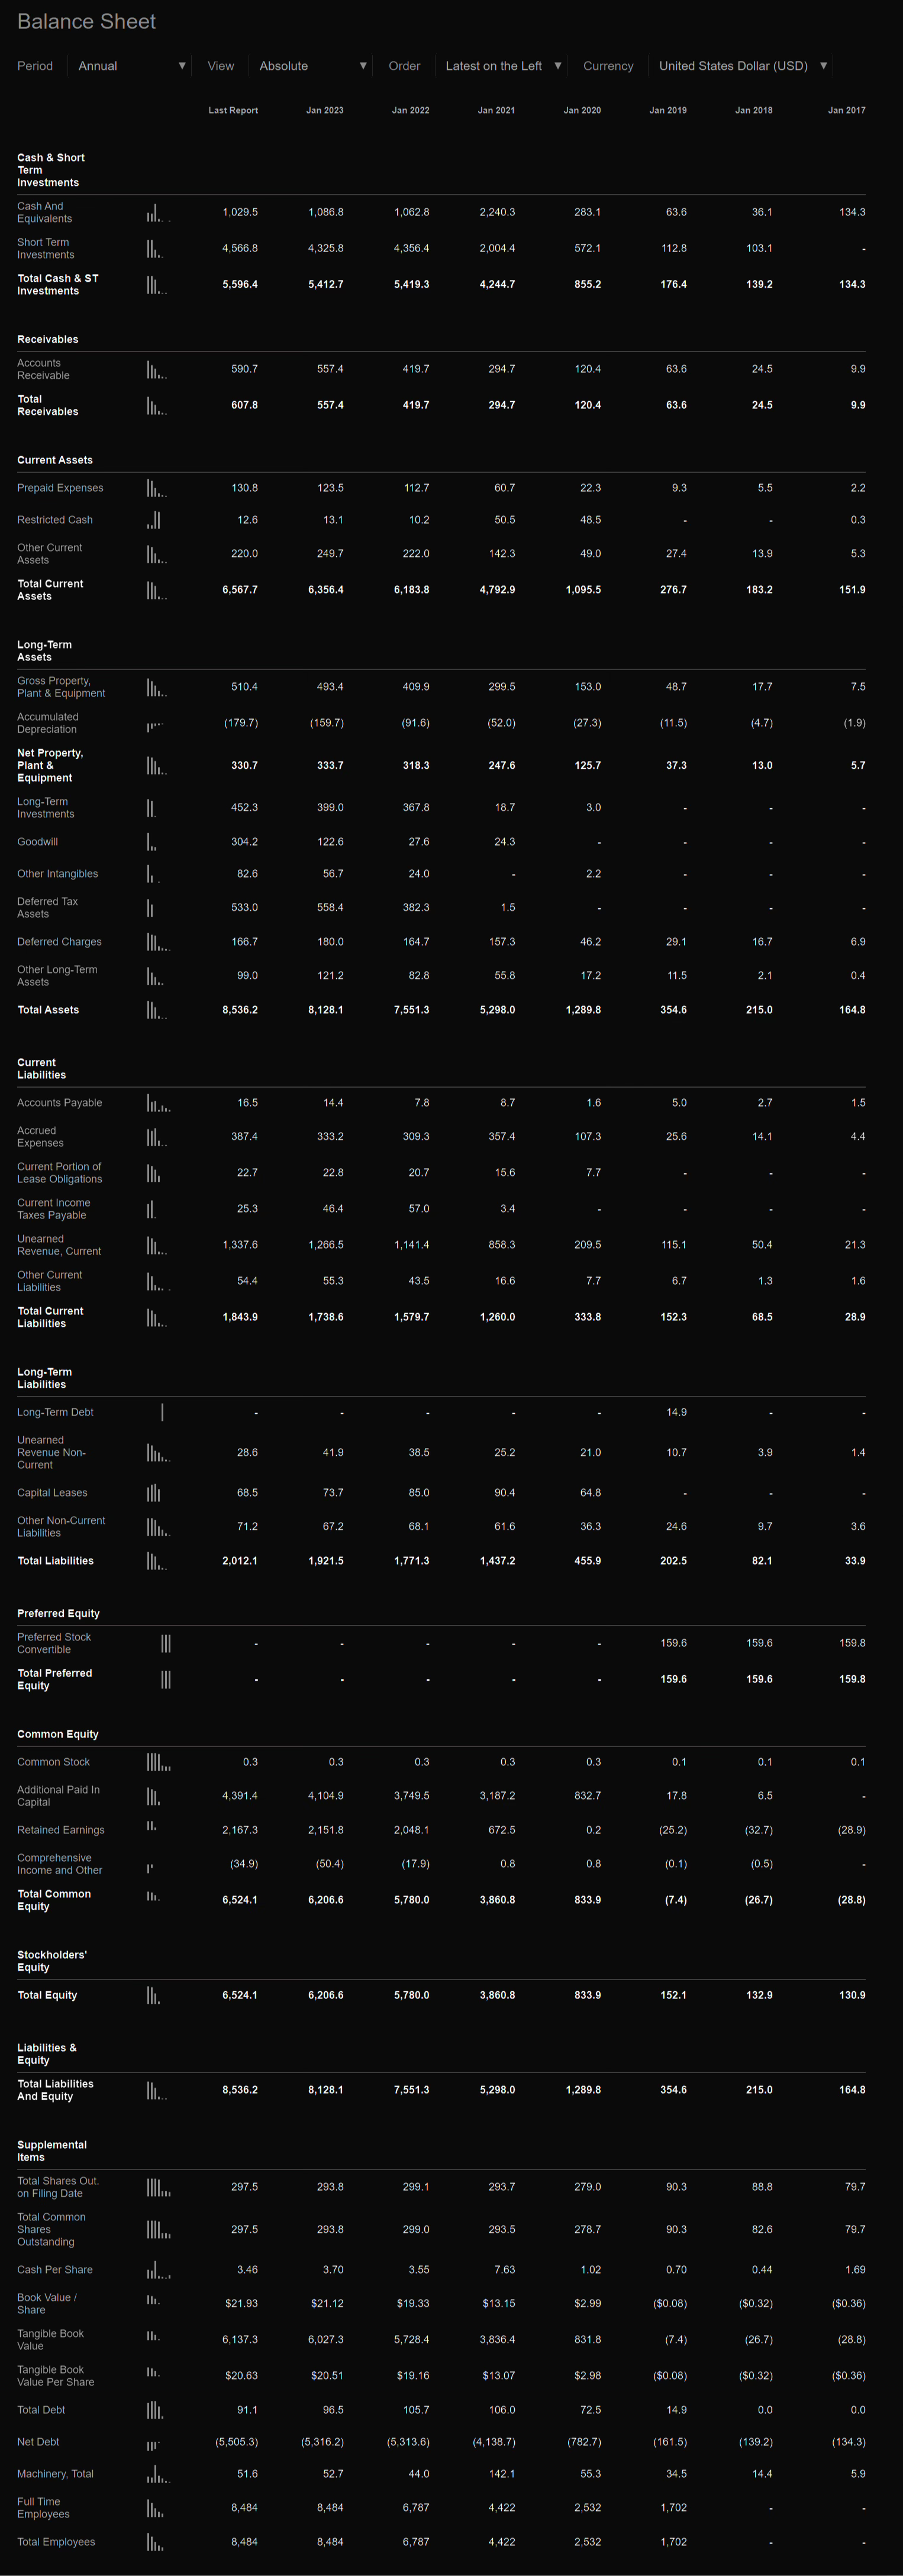
In this section, the key metrics to focus on: Total Liabilities, Equity, Total Employees, Retained Earnings, Debt, and Goodwill.
Each of these lines trends upward, consistent with a company that is actively growing and expanding.
Taken in isolation, without the income and cash flow context, the balance sheet looks fairly positive and logical. Goodwill is growing, equity and liabilities both show steady growth over the past several years. Debt growth has been modest year-over-year since 2020, and net debt is negative.
All of this reflects investment in R&D, innovation, assets, facilities, and headcount.
The balance sheet alone doesn’t give you the full picture of where the real problems and advantages lie. On to the next statement.
CONSOLIDATED STATEMENTS OF OPERATIONS
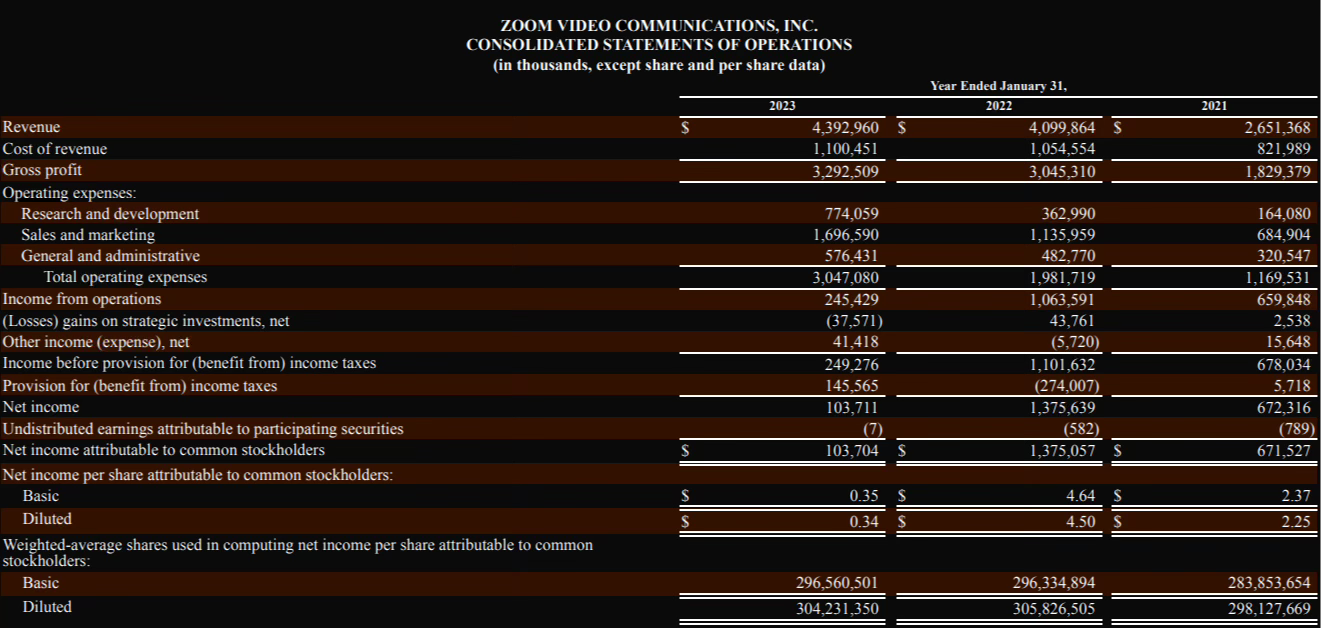
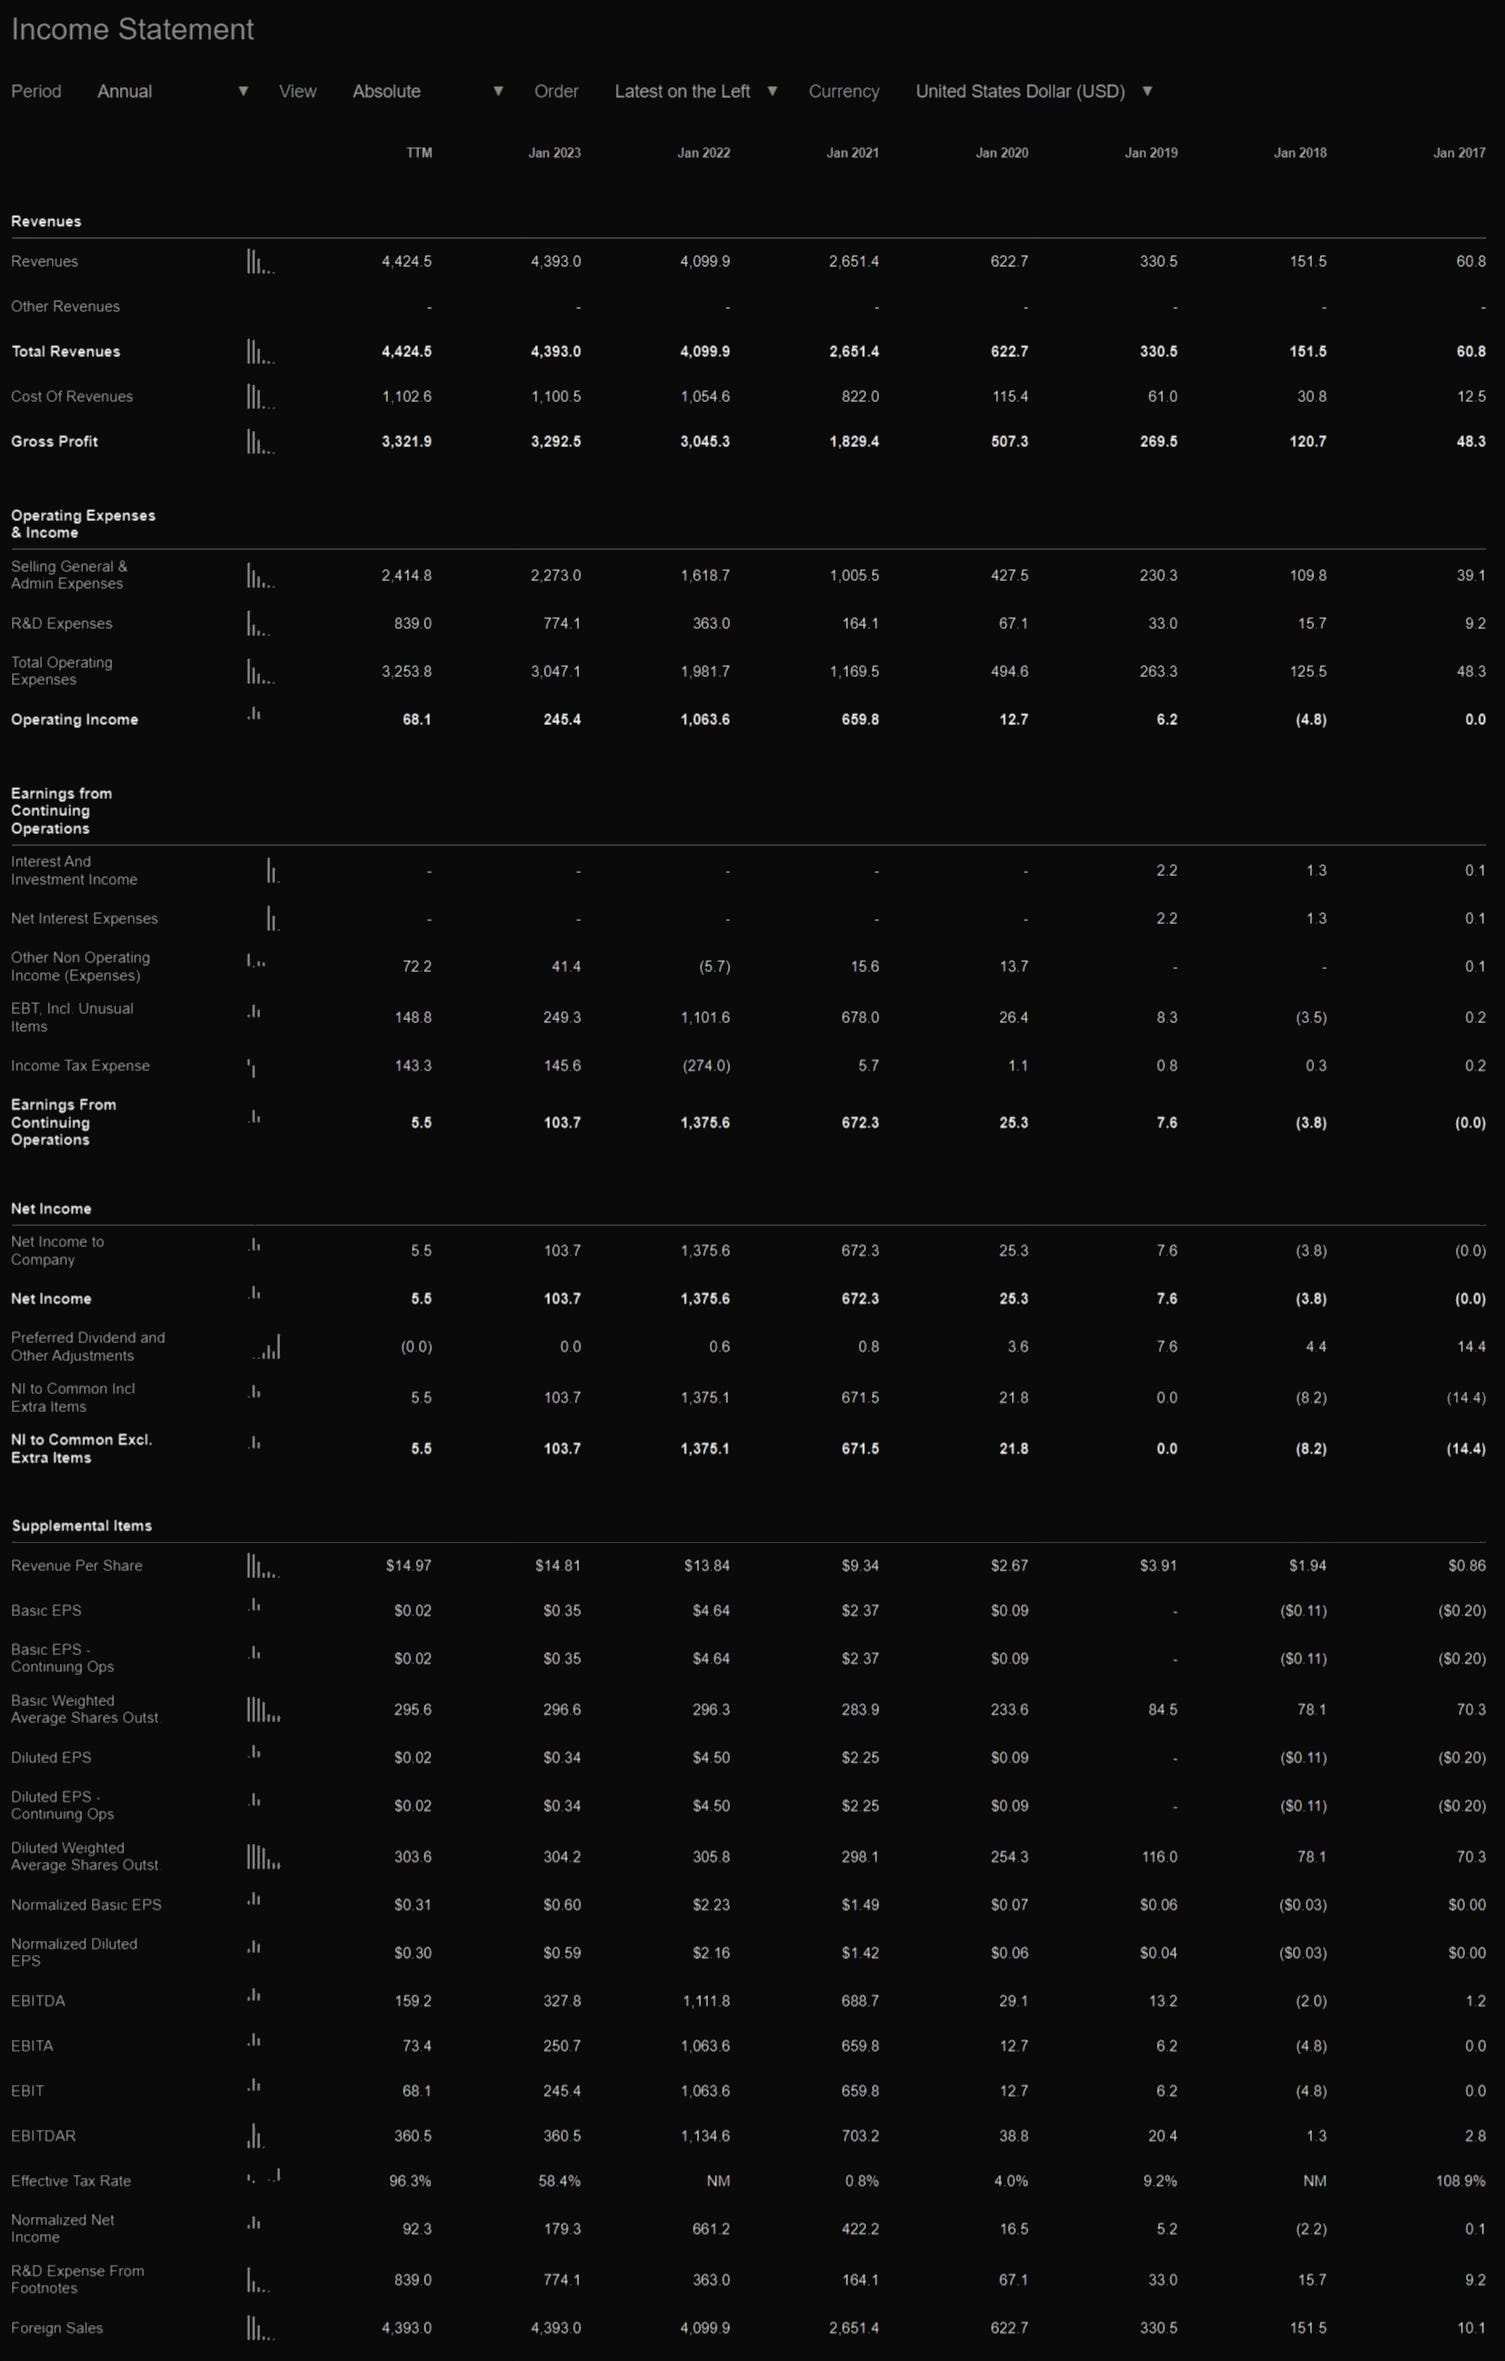
What stands out in this section: Revenue, Gross Margin, Operating Income, Net Income. In SeekingAlpha, EBITDA is the additional metric worth tracking.
The data makes one thing clear. During COVID-19 (2020-2021), Zoom’s numbers went parabolic. Essentially everyone was learning, meeting, and working remotely. Zoom displaced incumbents like Skype and Microsoft Teams by being more capable and more user-friendly: simpler to use, more feature-rich, more secure, better quality.
So why did the stock collapse despite the profitability growth?
Several reasons.
Competition. Zoom moved onto someone else’s turf. Competing with Microsoft, with a refined Microsoft Teams product and a very flexible pricing strategy, is hard.
COVID restrictions lifting. People are no longer in isolation. Zoom calls don’t happen at the same frequency. Revenue growth slowed, margins compressed. In 2021, restrictions were just beginning to ease. By 2022, the effect was tangible.
Overvalued stock. Macro factors also played a role: money supply expansion and inflation meant more cash in retail hands, more people investing in equities. The violent re-rating that had grossly overpriced the stock triggered position-unwinding once the first earnings reports came in below expectations.
The numbers that came out confirmed every concern investors had about profitability. Everyone expected the hyper-growth to continue. Instead, every key metric declined.
Now back to the balance sheet, in the context of current revenues and earnings.
The growth in liabilities and equity can be attributed to increased investment in R&D and proprietary technology. Still, they look high relative to the current financial results. But how do you explain the headcount growth through 2022? In a period of elevated rates, economic slowdown, and ballooning costs, Zoom kept hiring, which hit operating income disproportionately.
One thing worth noting: net debt. The numbers show a company with no net debt obligations. Cash exceeds total debt. Goodwill is also trending in the right direction.
On to the next statement for the full picture.
CONSOLIDATED STATEMENTS OF CASH FLOWS
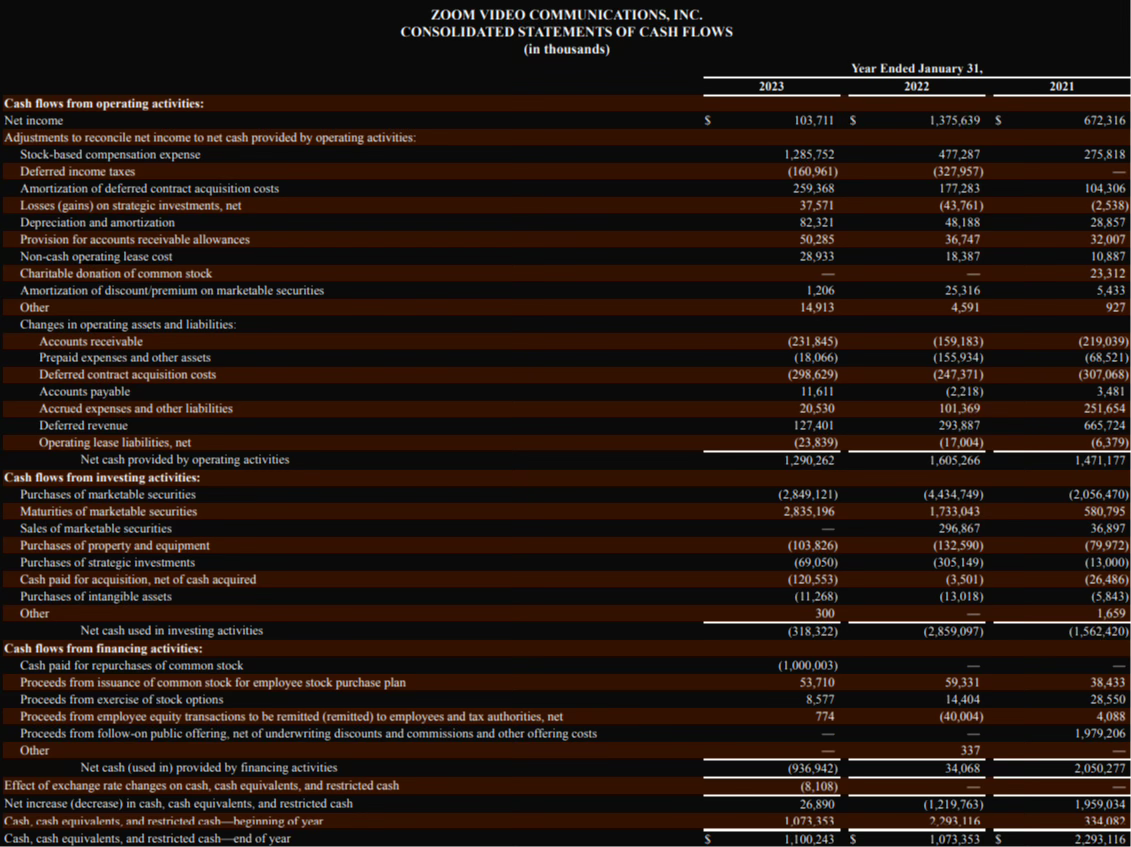
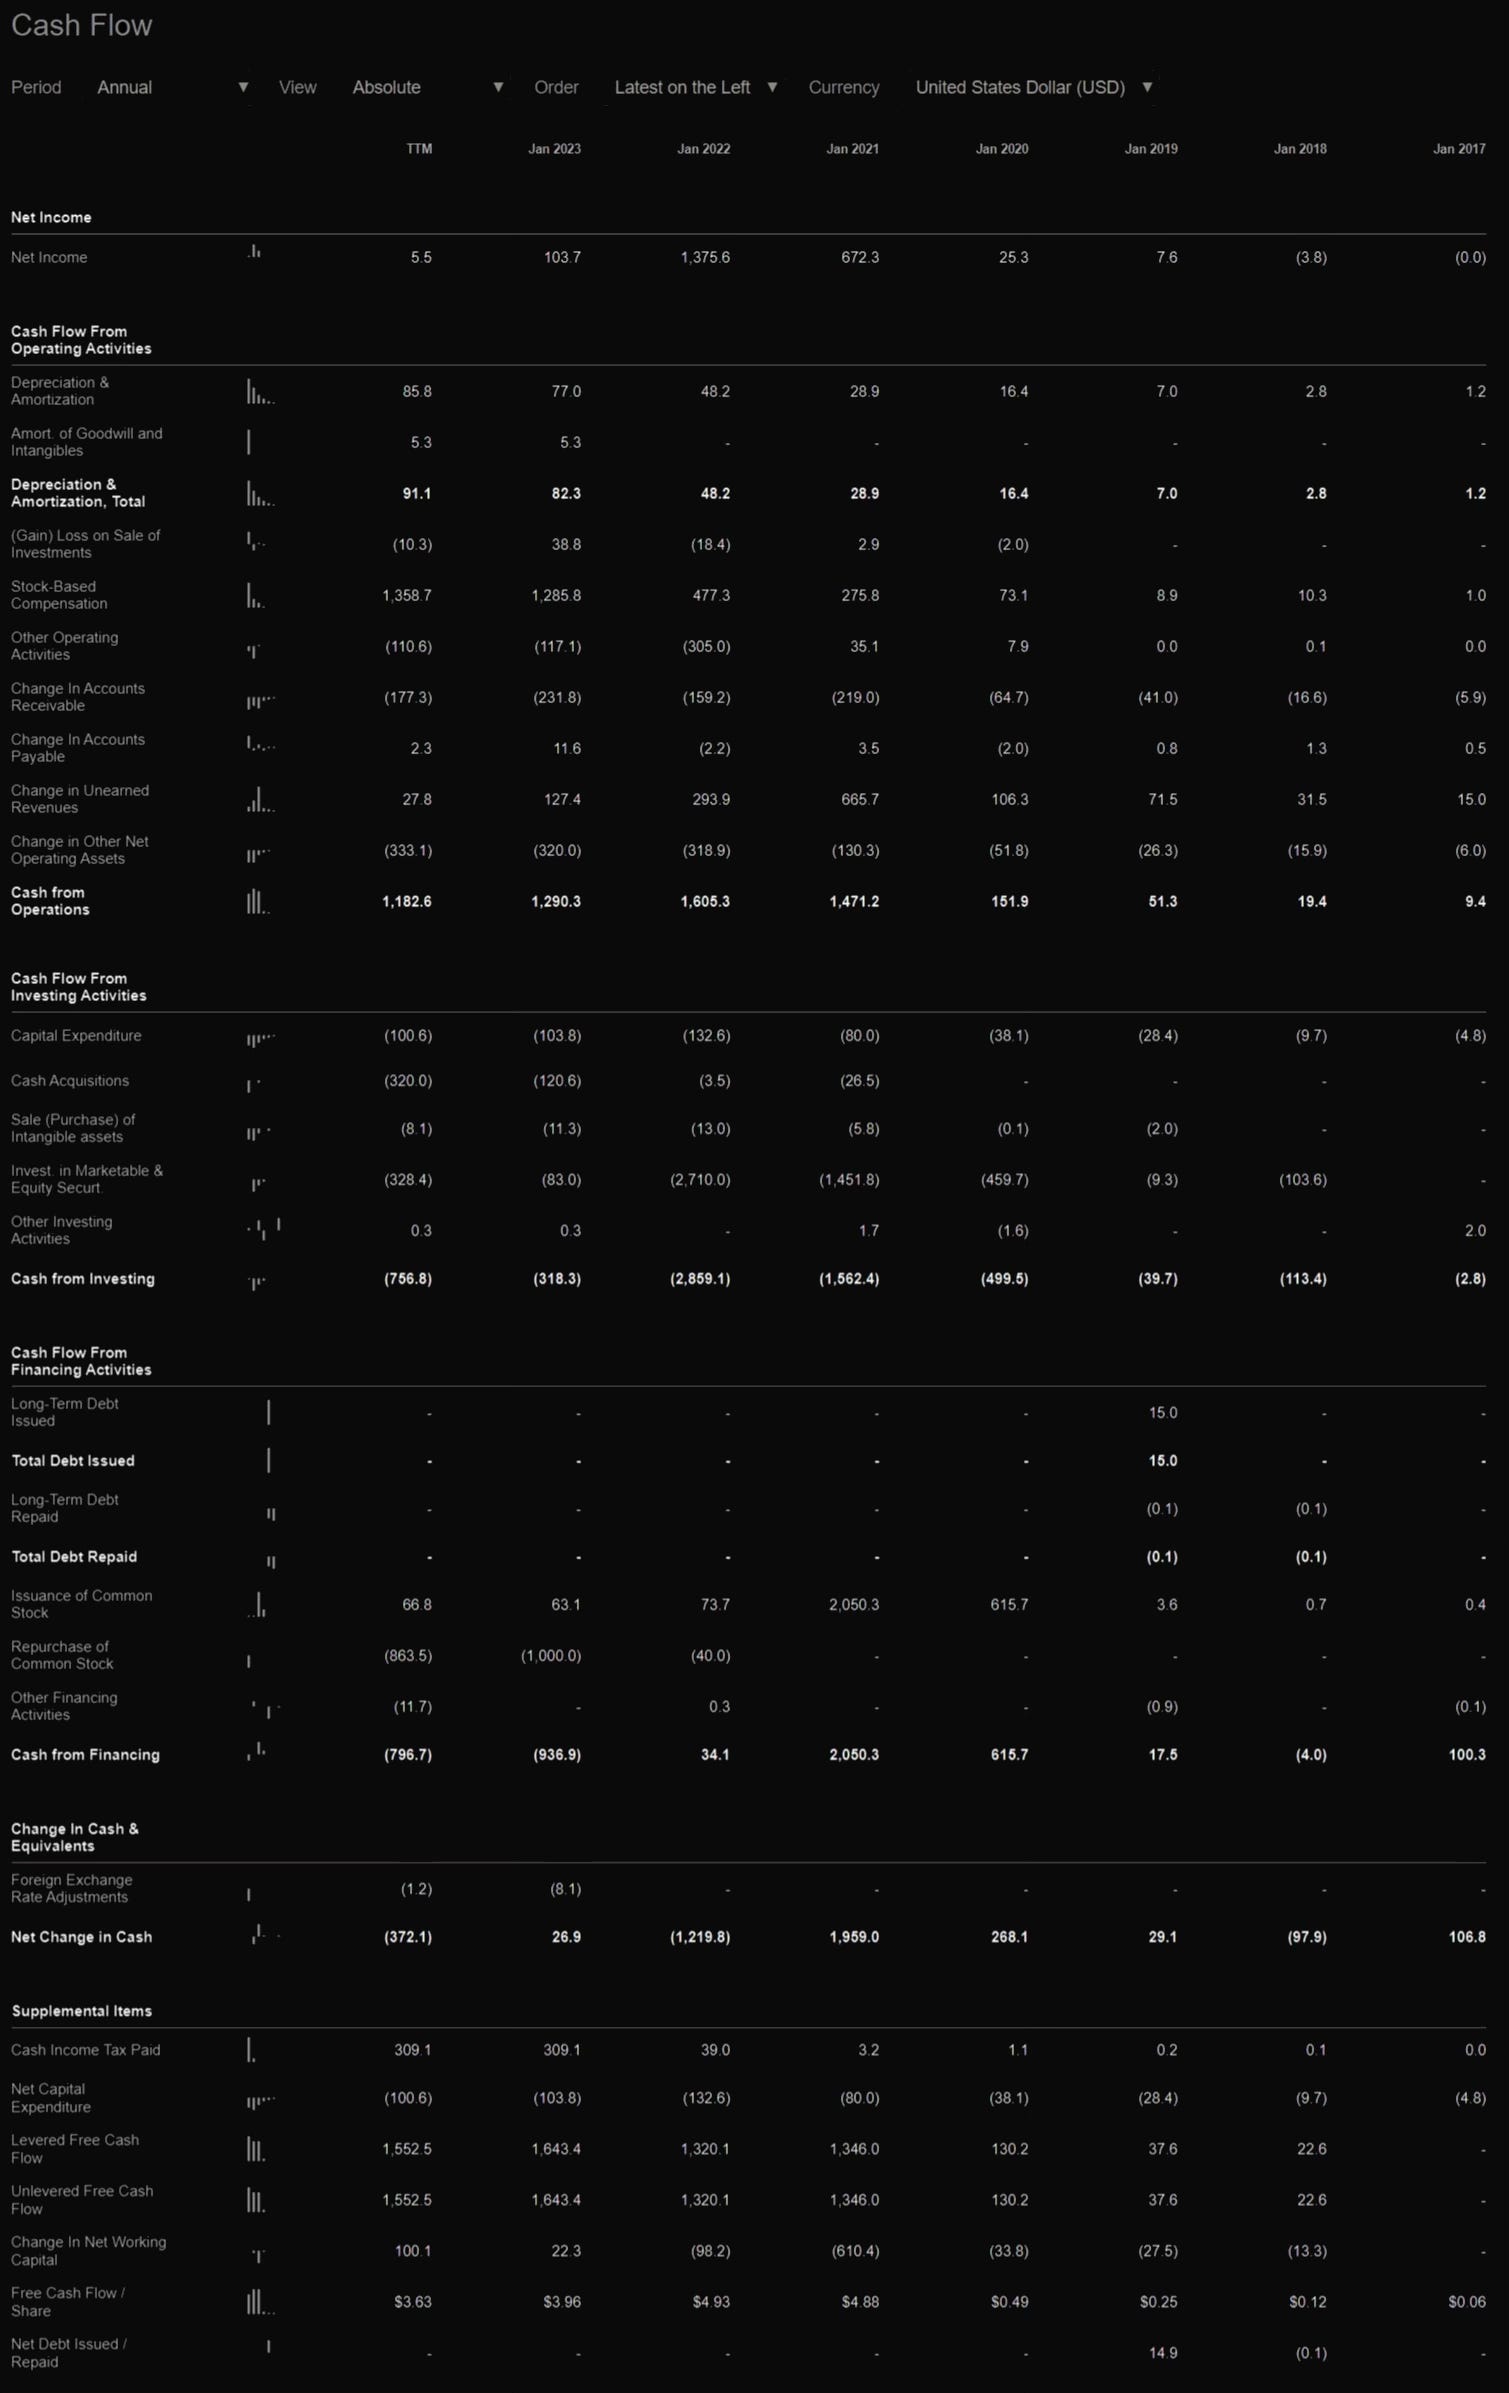
Easily the most important section. The key lines: Cash from Operations, Cash from Investing, Cash from Financing, and Free Cash Flow.
Cash from Operations
"Our largest source of cash from operating activities is cash receipts from our customers for subscriptions to our platform. Our primary uses of cash from operating activities are for employee-related expenses, expenses related to hosting our platform, and marketing expenses. Net cash provided by operating activities is impacted by our net income adjusted for certain non-cash items, such as stock-based compensation expense, depreciation and amortization expense, and the effect of changes in operating assets and liabilities. For the fiscal year ended January 31, 2023, net cash provided by operating activities was $1,290.3 million compared to $1,605.3 million for the fiscal year ended January 31, 2022. The decrease in cash flow from operating activities was primarily driven by increased income tax payments and an increase in deferred revenue."
We see the decline in operating cash flows and the stated reasons behind it. But while most companies were cutting headcount to reduce operating costs, Zoom chose not to.
Cash from Investing
“Net cash used in investing activities of $318.3 million for the fiscal year ended January 31, 2023 was primarily related to cash paid for an acquisition, net of cash acquired, of $120.6 million, purchases of property and equipment of $103.8 million, purchases of strategic investments of $69.1 million, net purchases of marketable securities of $13.9 million, and purchases of intangible assets of $11.3 million. Net cash used in investing activities of $2,859.1 million for the fiscal year ended January 31, 2022 was primarily related to net purchases of marketable securities of $2,404.8 million, purchases of strategic investments of $305.1 million, purchases of property and equipment of $132.6 million, purchases of intangible assets of $13.0 million, and cash paid for an acquisition, net of cash acquired, of $3.5 million.”
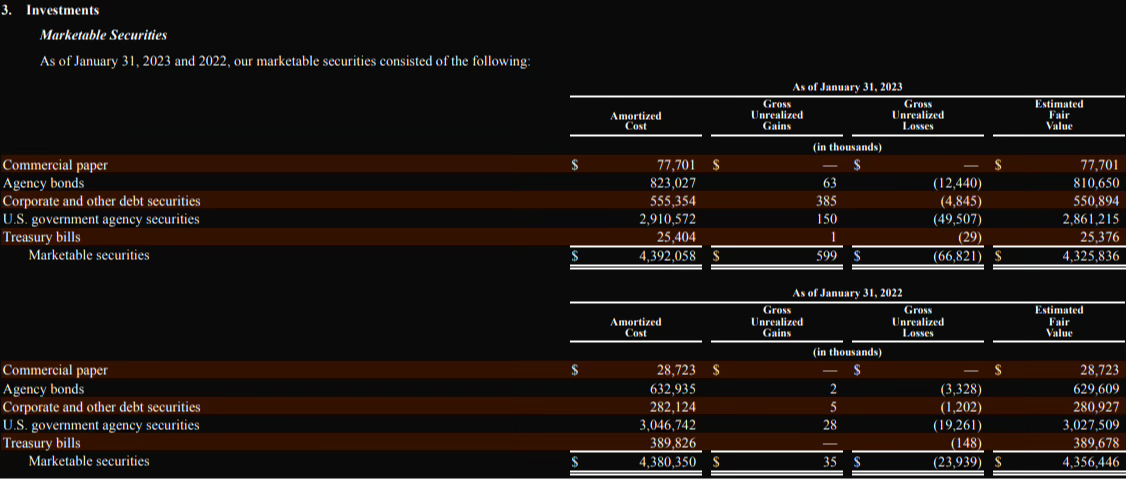
The investment portfolio consists of high-rated debt securities that are considered risk-free. These are cash equivalents. Buying them is capital preservation.
Cash from Financing
“Net cash used in financing activities of $936.9 million for the fiscal year ended January 31, 2023 was primarily related to cash paid for repurchases of common stock of $1.0 billion, partially offset by proceeds from issuance of common stock under our employee stock purchase plan (ESPP) of $53.7 million and proceeds from exercise of stock options of $8.6 million. Net cash provided by financing activities of $34.1 million for the fiscal year ended January 31, 2022 was primarily related to proceeds from issuance of common stock under our ESPP of $59.3 million, proceeds from exercise of stock options of $14.4 million, partially offset by proceeds from the sale of stock to international employees remitted to employees and tax authorities of $40.0 million.”
A quick note on ESPP: the Employee Stock Purchase Plan allows employees to purchase company shares at a discounted price. Employees allocate a portion of their salary toward buying stock, typically with added benefits or pricing discounts. It’s one of the ways companies align employee incentives with company performance.
In this case, the company spent significant capital buying back its own shares, which is part of a capital management strategy aimed at building long-term shareholder value. Stock option exercises generated additional inflows.
Free Cash Flow (FCF)
The SeekingAlpha table shows FCF per share, which represents the free cash flow available for the company’s own development.
FCF is the cash a company generates after accounting for operating expenses, capital expenditures, and changes in working capital. It represents the funds available for dividends, growth investment, debt repayment, or other corporate purposes.
FCF = Cash from Operations - Capital Expenditures
Yes, FCF has declined materially. But the company is still generating profit in a downturn, against intense competition from tech giants. Free Cash Flow above $1 billion is a solid financial buffer for Zoom, and it’s being deployed productively.
Form 10-Q
Opening Q1 FY2024. The two things I care most about: earnings and free cash flow.
Revenue is not falling. It’s broadly in line with prior quarters.
Gross profit is above every quarter in the past several years.
Operating and net income were in decline all through 2022, hitting negative territory. Q1 showed a small profit, which is a positive development: the company is still generating earnings in a high-rate environment.
Earnings Call Q1 FY2024
Eric Yuan, Founder and CEO of Zoom, Inc.:
“Last quarter we reaffirmed our strong AI position and outlined our expanded vision for how generative AI will permeate and enhance our portfolio. In Q1, we made significant progress executing on that vision.”
“At Enterprise Connect we unveiled a new set of ZoomIQ beta features leveraging generative AI to support chat and email composition and meeting summaries. We’re also building new features to summarize long chat threads, help latecomers catch up on what they missed, and facilitate whiteboard brainstorming.”
“We announced our strategic investment in Anthropic, an AI safety and research company focused on building reliable, interpretable, and steerable AI systems. Our partnership with Anthropic further strengthens our federated approach to AI, enabling Anthropic’s AI assistant, Claude, to be integrated across the Zoom platform.”Для понимания контекста:
For context: Zoom IQ for Sales is conversation analytics within meetings, capturing key items such as best questions asked, next-step commitments, engagement level, talk-time breakdown between your team and the customer.
Kelly Steckelberg, CFO:
“Enterprise customer count grew 9% year-over-year to approximately 215,900. Our trailing 12-month net dollar expansion rate for enterprise customers in Q1 was 112%. We saw 23% year-over-year growth in the up-market segment, finishing the quarter with 3,580 customers contributing over $100,000 in revenue over 12 months. These customers represent 29% of revenue versus 24% in Q1 of fiscal 2023 and span healthcare, education, government, and other verticals.”
“As expected, we experienced some distraction in our global sales organization due to the previously announced headcount reduction and the subsequent sales reorganization. Despite the distraction, revenue in the Americas grew 8% year-over-year, while EMEA and APAC declined 8% and 5% respectively. The EMEA decline was primarily driven by the outsized impact of headcount reduction due to local regulatory requirements prolonging the process, the Russia-Ukraine war, and a stronger dollar. The APAC decline was primarily driven by dollar strength.”
“Research and development expenses grew 25% year-over-year to approximately $106 million. As a percentage of total revenue, R&D increased to 9.6% from 7.9% in Q1 of last year, reflecting our investment in expanding the product portfolio, including Zoom Contact Center, AI, and more. Going forward, innovation remains Zoom’s top priority.”
“Sales and marketing expenses grew 4% year-over-year to $278 million, approximately 25.2% of total revenue versus 24.9% in Q1 of last year. General and administrative expenses declined 10% to $84 million, approximately 7.6% of total revenue versus 8.6% in Q1 of last year, as we focused on back-office efficiency and cost savings.”
“Our operating cash flow margin and free cash flow margin were 37.9% and 35.9%, respectively. Given an expected net legal settlement later this year, we are revising our FY24 cash flow guidance. We now expect free cash flow in the range of $1.14 to $1.19 billion.”
“As our online business stabilizes, we wanted to provide additional color on how we see it trending in the coming quarters. We expect online revenue of approximately $480 million in Q2, remaining relatively stable through FY24. We are pleased to raise our full-year revenue and profitability guidance. We now expect revenue in the range of $4.465 to $4.485 billion, representing approximately 2% year-over-year growth on average, or 3% in constant currency.”
Analyst Ratings at Time of Analysis
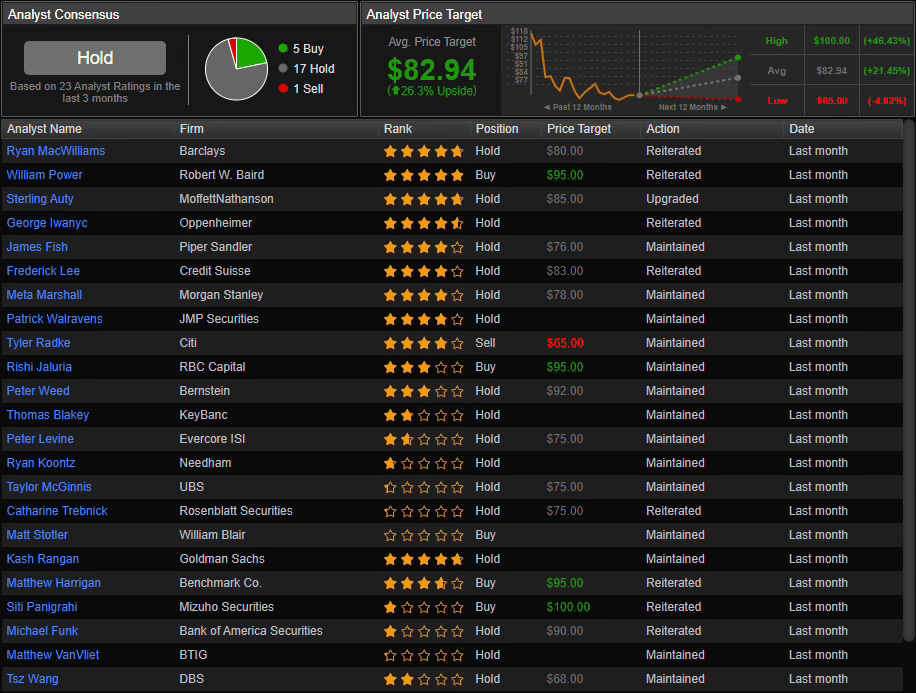
When reviewing analyst targets, weight the five-star analysts.
The top-rated analysts have targets ranging from $80 to $90. Given what the calls and recent filings show, that’s a fully justified valuation.
Summary
Zoom operates in a competitive and demanding environment, building a product that goes head-to-head with Microsoft. The Zoom Meetings vs. Microsoft Teams debate has generated extensive commentary. The choice is genuinely difficult given the pricing pressure the competitor has imposed.
Looking at the financials from the last reported year: the stock decline is well-warranted. Revenue is flat, net income is down roughly 10x year-over-year. The most recent quarter, however, shows signs of bottoming after the extended earnings compression. That is a positive signal for investors.
Reading through the latest earnings call, the company is aggressively integrating AI and deploying substantial capital into product development, while maintaining over $1 billion in free cash flow as a financial buffer. Management guidance is constructive, with meaningful revenue and earnings growth projected for the year.
Institutional investors trimmed positions over the past month. The context behind those decisions isn’t visible, but the selling started in May, which looks like gradual profit-taking.
Zoom is not out of the race. Despite the sharp drawdown, there are enough arguments to support a case for potential recovery.
One more thing: beyond the financial filings, watch the product release pipeline and competitor moves closely. That's one of the most meaningful drivers of where this stock goes from here.